NAS100 Analysis – June 22
A downside crash for NAS100 appears imminent following a rejection at the key resistance level of $22,140. The index recently faced strong resistance around this level, which coincides with a previously tested supply zone. Price action is beginning to decline after failing to sustain momentum above the 9-day Simple Moving Average (SMA), currently near $21,760. The Relative Strength Index (RSI) has cooled to approximately 56.23, indicating a weakening bullish momentum as it moves further away from overbought conditions. The index has also formed a lower high compared to its recent peak, signaling potential bearish sentiment and a fading bullish grip.
NAS100 Key Levels
Resistance Levels: $22,140, $23,000, $24,050
Support Levels: $21,400, $20,360, $18,320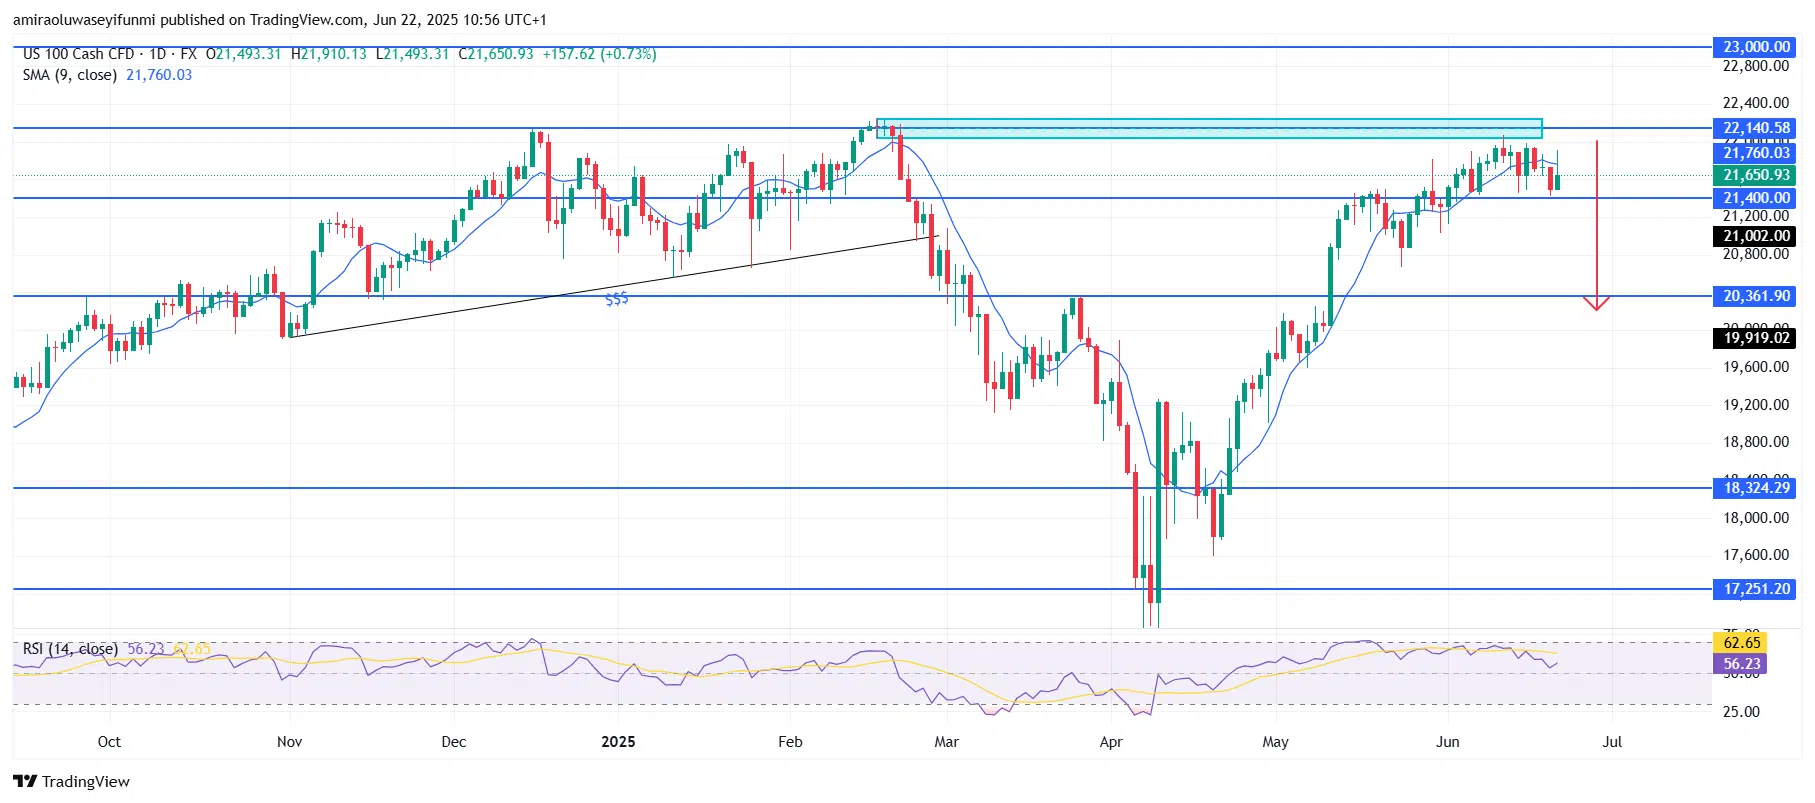
NAS100 Long-Term Trend: Bearish
Price action has been unable to establish new highs above the $22,140–$22,400 zone, instead forming a double-top pattern with diminishing follow-through. This technical signal, combined with the failure to maintain the support level at $21,400, suggests a potential breakdown is underway. Candlestick formations featuring long upper wicks highlight strong selling pressure at higher levels. If this supply pressure continues, the current structure points toward a bearish continuation, especially after repeated failures to overcome this resistance cluster.
Looking ahead, a decisive break below $21,400 could pave the way toward the $21,000 level. Sustained bearish momentum may drive the index further down to the more substantial demand zone near $20,360, which coincides with a historical consolidation area and may offer temporary support. However, if overall market sentiment continues to deteriorate, the NAS100 could decline further, with $18,320 emerging as a more distant yet realistic target. Overall, the technical indicators and price action signal a bearish outlook in the short to medium term unless buyers reclaim the $22,140 zone.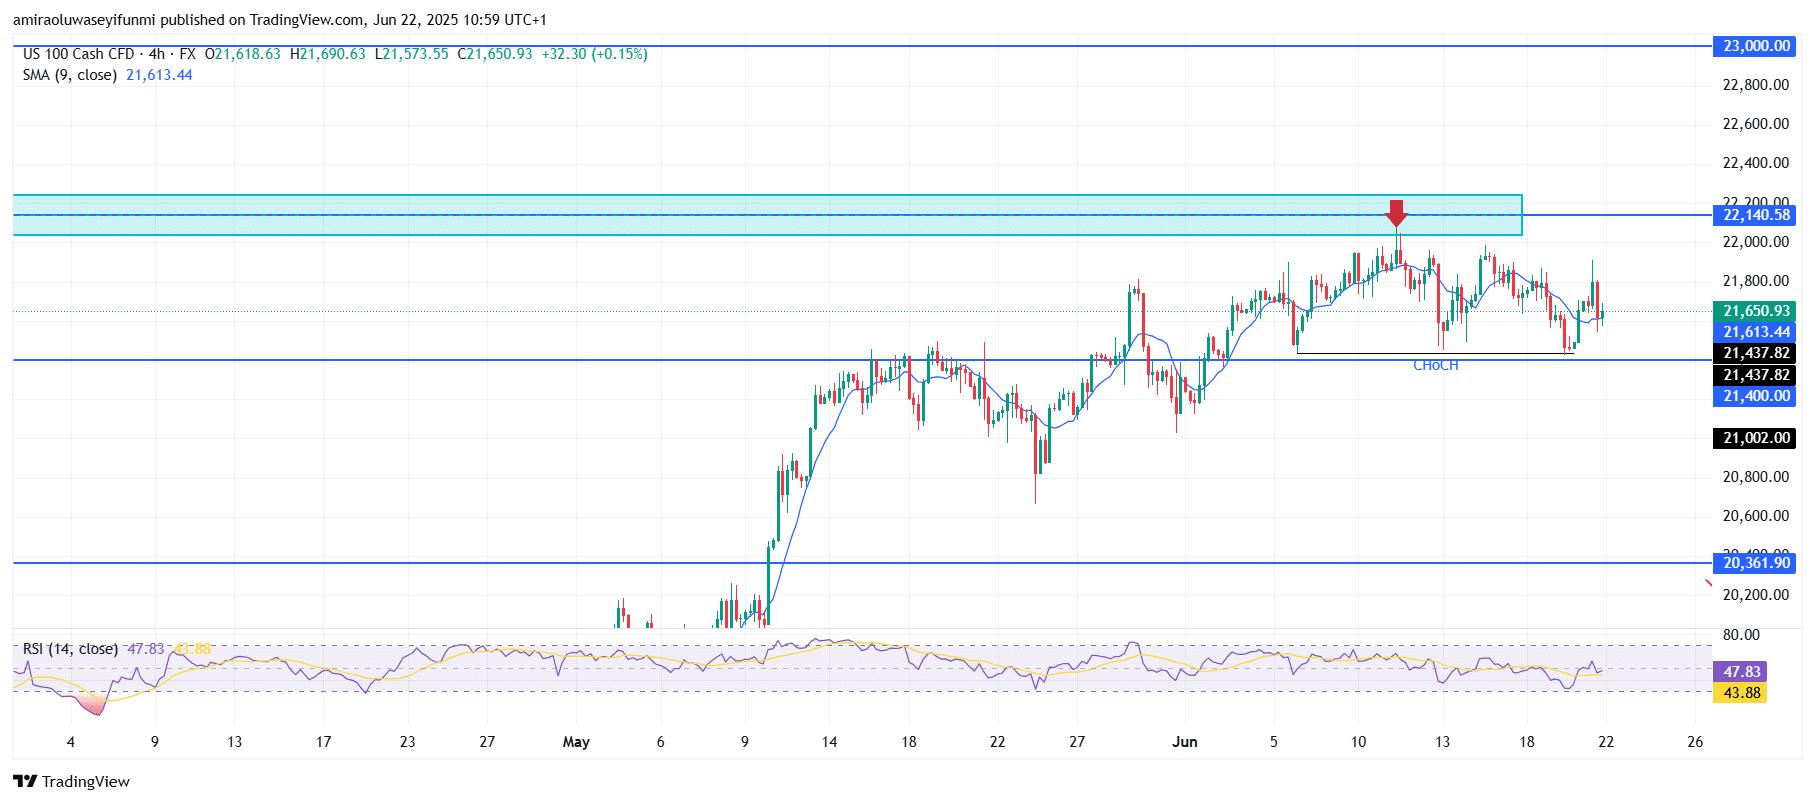
NAS100 Short-Term Trend: Bearish
The NAS100 has confirmed a bearish structural shift following a clear Change of Character (CHOCH) below the $21,440 level. Price experienced a strong rejection from the $22,140 supply zone and has since formed lower highs, consolidating beneath the 9-period SMA.
The RSI has dropped below the midpoint to 47.83, further suggesting a decline in bullish momentum. With sellers actively defending resistance and the structure shifting downward, price is likely to revisit the $21,000 level, and potentially drop further toward $20,360. At this point, traders may look to forex signals for timely market entries and exits as the bearish pressure intensifies.
Make money without lifting your fingers: Start using a world-class auto trading solution
How To Buy Lucky Block – Guide, Tips & Insights | Learn 2 Trade
Note: Learn2.trade is not a financial advisor. Do your research before investing your funds in any financial asset, product, or event. We are not responsible for your investment results.
- Broker
- Min Deposit
- Score
- Visit Broker

- Award-winning Cryptocurrency trading platform
- $100 minimum deposit,
- FCA & Cysec regulated

- 20% welcome bonus of upto $10,000
- Minimum deposit $100
- Verify your account before the bonus is credited
- Fund Moneta Markets account with a minimum of $250
- Opt in using the form to claim your 50% deposit bonus
Learn to Trade
Never Miss A Trade Again

Signal Notification
Real-time signal notifications whenever a signal is opened, closes or Updated

Get Alerts
Immediate alerts to your email and mobile phone.

Entry Price Levels
Entry price level for every signal Just choose one of our Top Brokers in the list above to get all this free.