Lucky Block – Guide, Tips & Insights | Learn 2 Trade Price Forecast – Expert Analysis & Trading Tips | Learn 2 Trade – Expert Analysis & Trading Tips | Learn 2 Trade – August 22
The Lucky Block – Guide, Tips & Insights | Learn 2 Trade price forecast is for the market to leap off the $0.0018350 significant support zone to break the $0.0030050 critical level.
LBLOCK/USD Long-Term Trend: Bullish (30-Minute Chart)
Key Levels:
Supply Zones: $0.0030050, $0.0025050
Demand Zones: $0.0018350, $0.0016400 .0018350 Support Level" width="1280" height="800" data-lazy-src="https://learn2.trade/wp-content/uploads/2022/08/Lblock-30-2.jpg"/>
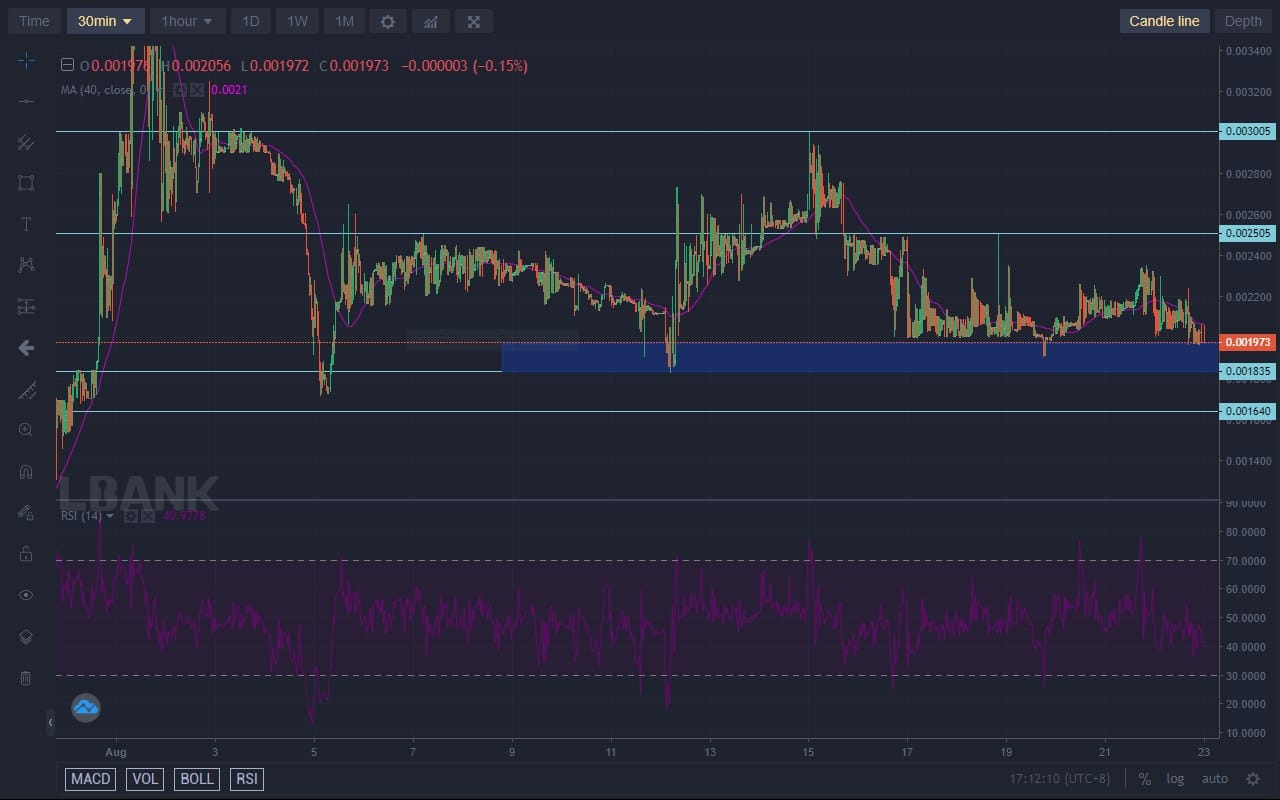
Lucky Block – Guide, Tips & Insights | Learn 2 Trade Market Expectation: LBLOCK/USD Revives Bullishness
Lucky Block – Guide, Tips & Insights | Learn 2 Trade entered this month on a bullish note. However, a moment of weakness allowed the sellers to plunder the market. Therefore, the price plummeted through several key levels to reach $0.0018350.
Buyers have begun to engineer a return of the coin from the level where it dropped. Lucky Block – Guide, Tips & Insights | Learn 2 Trade has properly situated itself on the $0.0018350 key level and breached the $0.0025050 level, but the price drops back.
Momentum is being gathered at the current level. And with a strong level as support, LBLOCK will spring upward. The RSI (Relative Strength Index) line has lifted off the oversold region line.
LBLOCK/USD Medium-Term Trend: Bullish (5-minute chart)
The 5-minute chart shows the MA period 40 largely moving through the candlesticks. The price has initially lifted off the support level but has pulled back to it again. Lucky Block – Guide, Tips & Insights | Learn 2 Trade is anticipated to spring upward from this support level at any moment from now. .0018350 Support Level" width="1265" height="781" data-lazy-src="https://learn2.trade/wp-content/uploads/2022/08/LBlock-5-2.jpg"/>
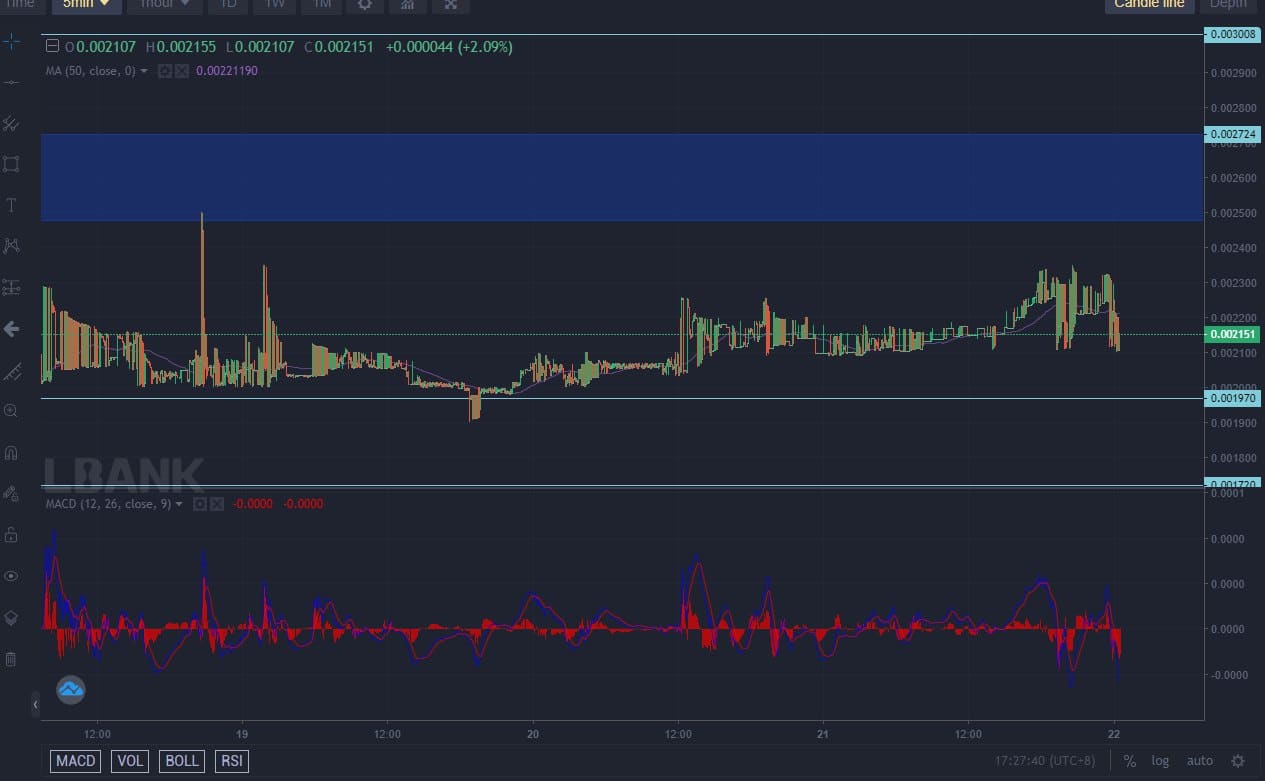
You can purchase Lucky Block – Guide, Tips & Insights | Learn 2 Trade here. Buy LBLOCK
Note: Learn2.trade is not a financial advisor. Do your research before investing your funds in any financial asset or presented product or event. We are not responsible for your investing results.
- Broker
- Min Deposit
- Score
- Visit Broker

- Award-winning Cryptocurrency trading platform
- $100 minimum deposit,
- FCA & Cysec regulated

- 20% welcome bonus of upto $10,000
- Minimum deposit $100
- Verify your account before the bonus is credited
- Fund Moneta Markets account with a minimum of $250
- Opt in using the form to claim your 50% deposit bonus
Learn to Trade
Never Miss A Trade Again

Signal Notification
Real-time signal notifications whenever a signal is opened, closes or Updated

Get Alerts
Immediate alerts to your email and mobile phone.

Entry Price Levels
Entry price level for every signal Just choose one of our Top Brokers in the list above to get all this free.