DeFI Coin Price Forecast – Expert Analysis & Trading Tips | Learn 2 Trade – Expert Analysis & Trading Tips | Learn 2 Trade – Expert Analysis & Trading Tips | Learn 2 Trade – Expert Analysis & Trading Tips | Learn 2 Trade – August 22
DeFi Coin price forecast anticipates a pump in price from the support level to hunt for liquidity at $0.07590. The market created large gaps of market inefficiency on the 22nd of July. The bulls are expected to retrace higher to mitigate the region of the market’s inefficiency.
DEFCUSD Long-Term Trend: Bullish (1-hour chart)
Significant Levels:
Supply Zones: $0.07590, $0.0830
Demand Zones: $0.07180, $0.06750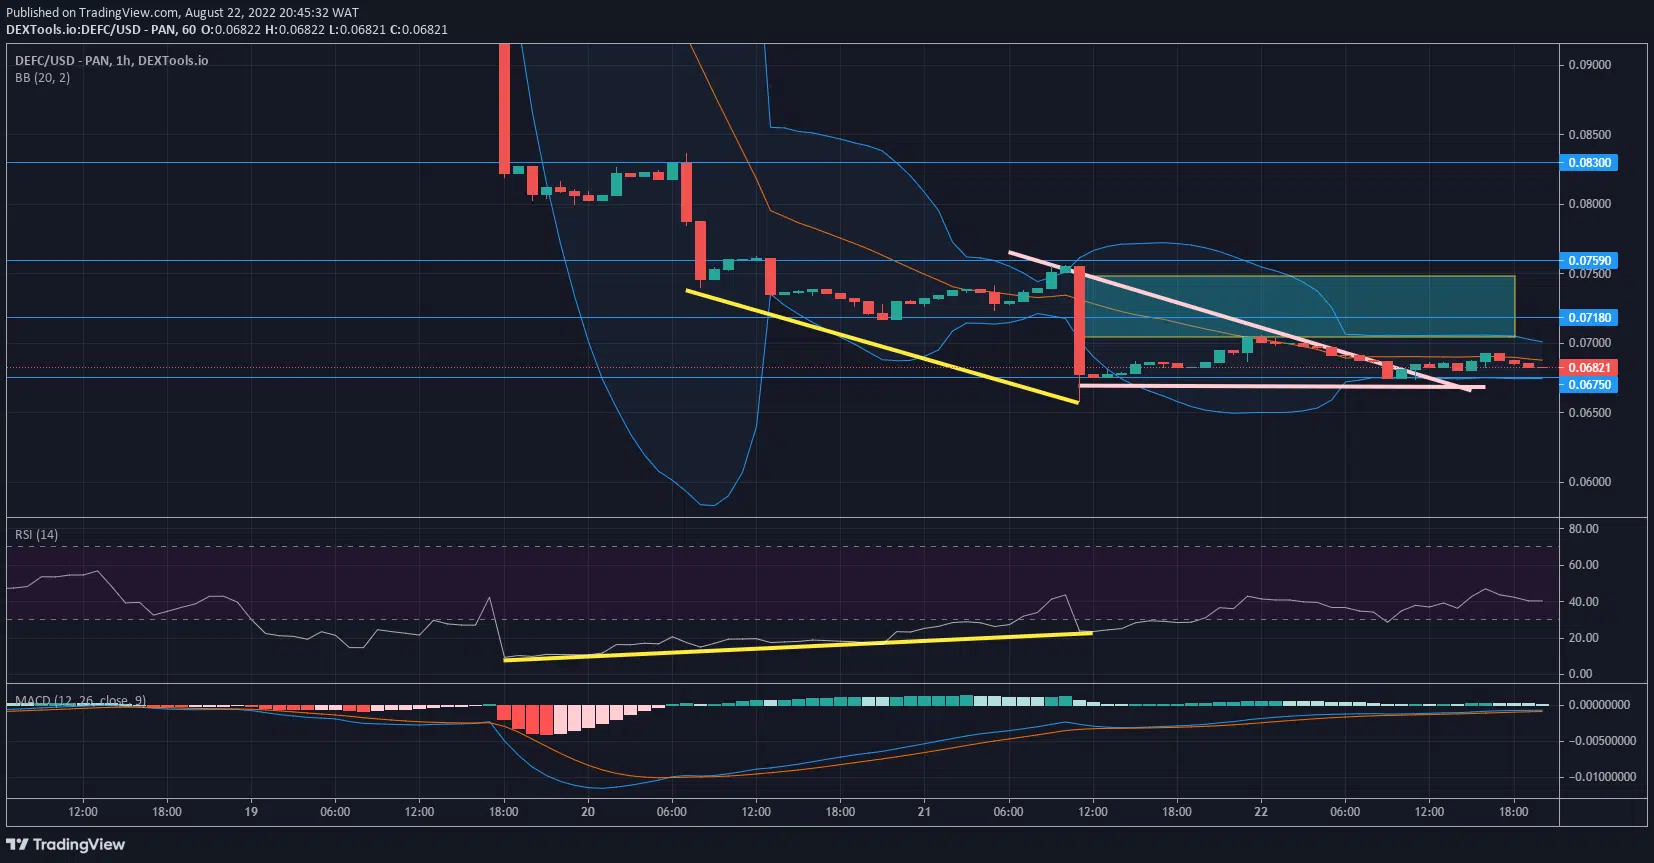
DeFI Coin Price Forecast – Expert Analysis & Trading Tips | Learn 2 Trade – Expert Analysis & Trading Tips | Learn 2 Trade – Expert Analysis & Trading Tips | Learn 2 Trade – Expert Analysis & Trading Tips | Learn 2 Trade: Market Outlook
The demand level at $0.06750 has provided support for the bullish run on DEFCUSD. The price of DeFI reached $0.06750 on the 21st of August. A prominent shadow formed beneath the candle that tapped the demand level to signify a rejection. This has caused the intraday candles to bounce off the demand level.
The market is currently correcting back upward to cover for the market inefficiency. The areas of inefficiency above the $0.06750 are serving as a magnet to draw price. The market has broken off a falling triangle to seek liquidity at $0.07590.
The hourly candles have pressed on the lower Bollinger Band to provide bullish support at the $0.06750 support level. The MACD ( Moving Average Convergence Divergence) indicator also favours the push-up of the price as it lurks in the oversold region.
DEFC Medium-Term: Trend Bullish (15-minute chart)
The 15-minute chart shows a steady rise from the support level at $0.06750. The current accumulation phase is expected to lead to a bullish distribution above $0.07180. 
You can purchase DeFi Coin here: Buy DEFC
Note: Learn2.trade is not a financial advisor. Do your research before investing your funds in any financial asset or presented product or event. We are not responsible for your investing results.
- Broker
- Min Deposit
- Score
- Visit Broker

- Award-winning Cryptocurrency trading platform
- $100 minimum deposit,
- FCA & Cysec regulated

- 20% welcome bonus of upto $10,000
- Minimum deposit $100
- Verify your account before the bonus is credited


- Fund Moneta Markets account with a minimum of $250
- Opt in using the form to claim your 50% deposit bonus