Ever since news broke of the U.S. slowing down on its trade tariff policy, the general stock market has been experiencing some form of upward recovery. The Japan 225 market appears to be on a solid path to recovery. Let’s further examine the price trajectory in this market.
Key Price Levels
Resistance Levels: 34,000, 36,000, 38,000
Support Levels: 32,000, 30,000, 28,000
Nikkei 225 Stays Afloat Above the 33,000 Price Mark
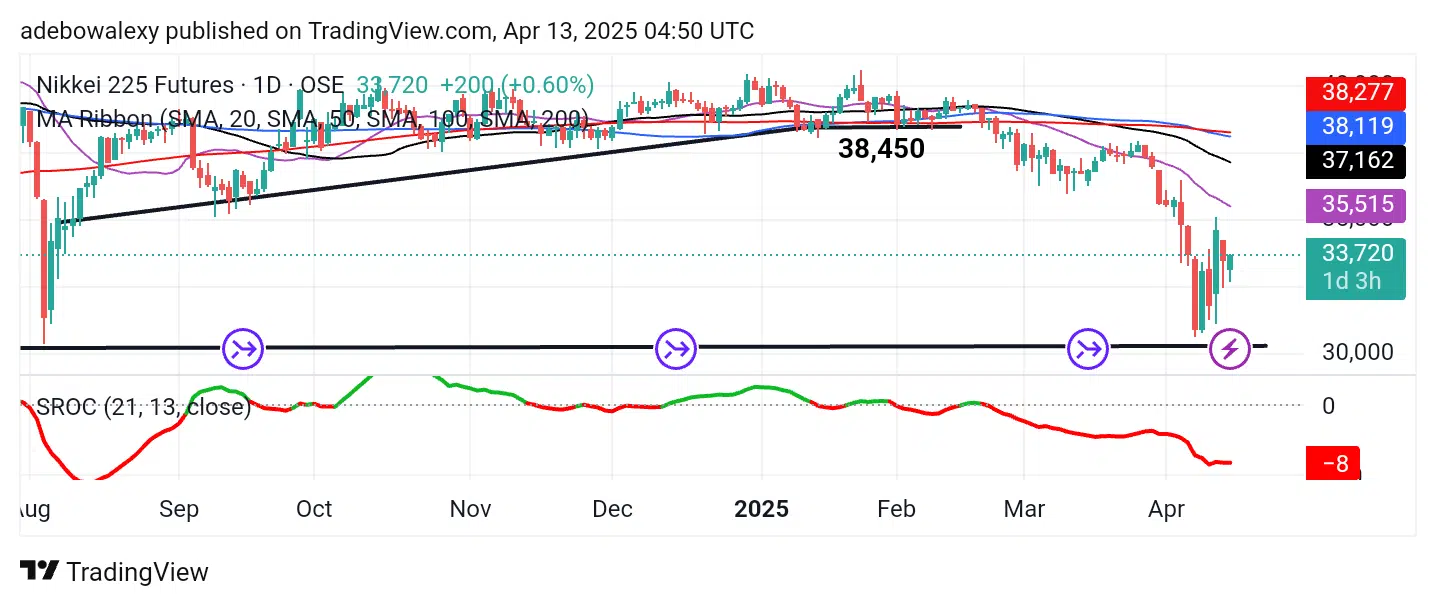
The Japan 225 daily market ended last week’s trading session in the green. This was observed as price action rebounded off the support level at 33,000. As a result, the last price candle was green, bringing the market to trade at the 33,678 level.
Meanwhile, price action remains below all the MA lines on the chart. However, the Stochastic Rate of Change (SROC) indicator line remains below the equilibrium level but is trending upward. This suggests that price action may continue to push higher.
Japan 225 Bulls Stay Positive
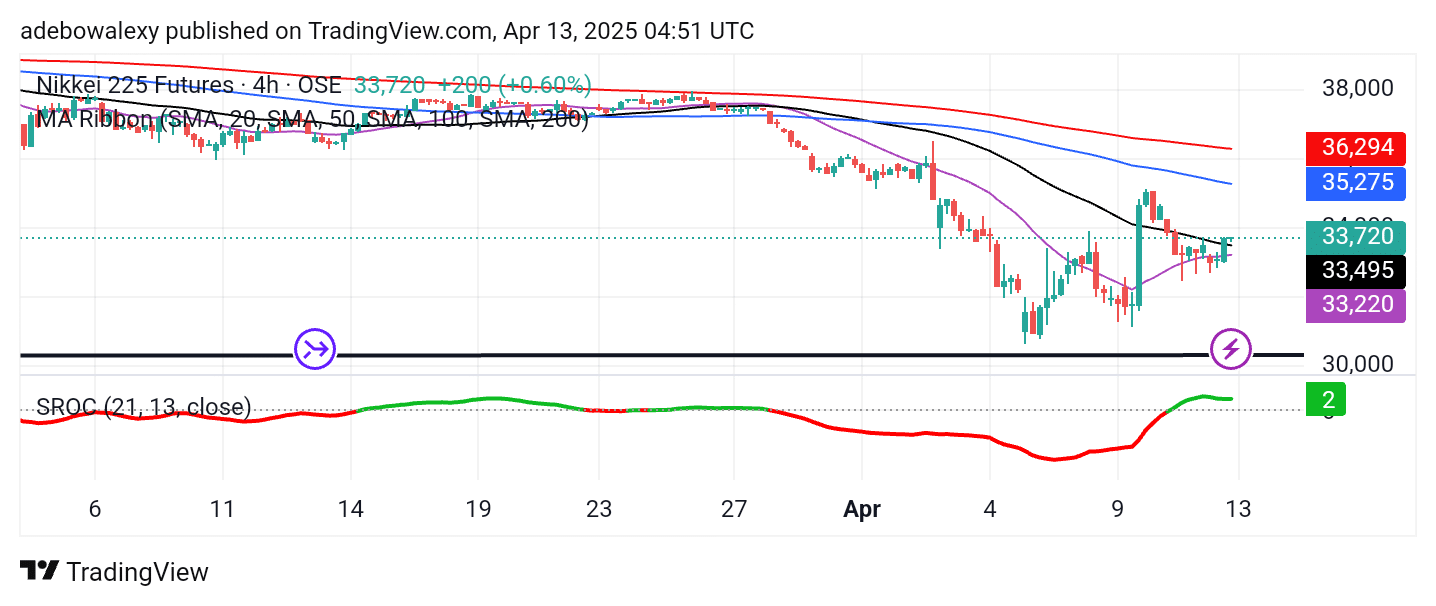
While the daily Nikkei 225 price chart presents a somewhat gloomy outlook, the 4-hour chart offers a brighter perspective. In this chart, the market is currently trading above the 20- and 50-day MA lines. The latest price candle is green but compressed, indicating that price action is encountering resistance.
Nevertheless, the SROC indicator line stays above the equilibrium level, and its latter section remains green. Therefore, this market still has the potential to breach the 34,000 price level and reach the 34,200 mark. However, market-moving fundamentals will play a key role in this development.
Make money without lifting your fingers: Start trading smarter today
- Broker
- Min Deposit
- Score
- Visit Broker

- Award-winning Cryptocurrency trading platform
- $100 minimum deposit,
- FCA & Cysec regulated

- 20% welcome bonus of upto $10,000
- Minimum deposit $100
- Verify your account before the bonus is credited
- Fund Moneta Markets account with a minimum of $250
- Opt in using the form to claim your 50% deposit bonus
Learn to Trade
Never Miss A Trade Again

Signal Notification
Real-time signal notifications whenever a signal is opened, closes or Updated

Get Alerts
Immediate alerts to your email and mobile phone.

Entry Price Levels
Entry price level for every signal Just choose one of our Top Brokers in the list above to get all this free.