Key Resistance Zones: 23200, 23600, 24000
Key Support Zones: 20800, 20400, 20000
Japan 225 (JP225USD) Long-term Trend: Ranging
The index has continued to fluctuate between levels 22000 and 23000. Presently, the price has broken the resistance line and has continued to fluctuate above it. The price action is characterized by small body candlesticks called Doji.
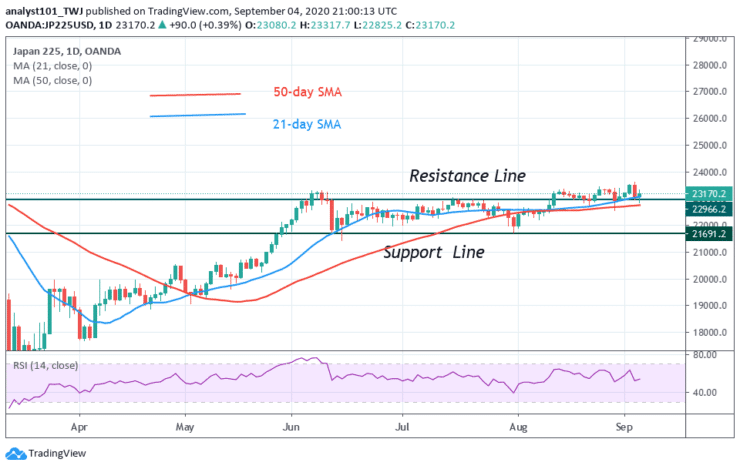
Daily Chart Indicators Reading:
Japan 225 is at level 52 of the Relative Strength Index. It indicates that the market is in the midpoint of the centerline 50. In other words, there is a balance between supply and demand. The 21-day SMA and 50-day SMA are sloping sideways indicating the sideways move.
Japan 225 (JP225USD) Medium-term Trend: Bearish
On the 4- hour chart, the market was earlier in an upward move. The index is fluctuating above the resistance line. It is also trading below the 23600 resistance. The price was corrected upward and resumed consolidation above level 22900.
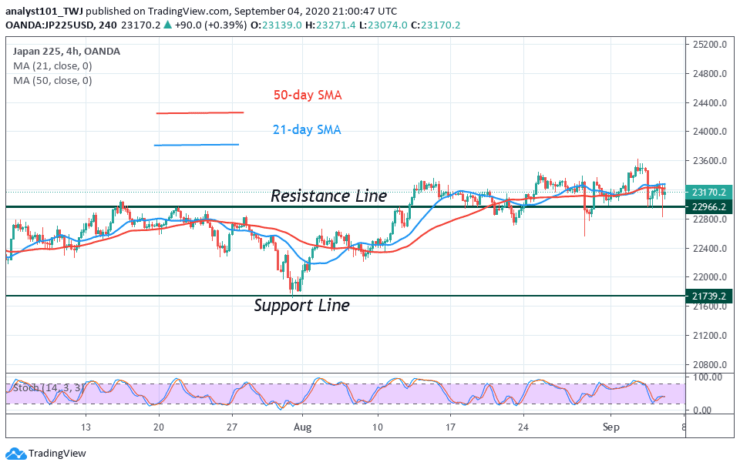
4-hour Chart Indicators Reading
The 21-day SMA and the 50-day SMA are sloping downward indicating the downtrend. JP225USD is below the 50% range of the daily stochastic. It implies that the market is in a bearish momentum.
General Outlook for Japan 225 (JP225USD)
Japan’s 225 index is trading above the resistance line of the horizontal channel. The market is in a sideways trend and above the upper price range. The bulls have been pushing price to the previous highs.
Note: Learn2Trade.com is not a financial advisor. Do your research before investing your funds in any financial asset or presented product or event. We are not responsible for your investing results
- Broker
- Min Deposit
- Score
- Visit Broker

- Award-winning Cryptocurrency trading platform
- $100 minimum deposit,
- FCA & Cysec regulated

- 20% welcome bonus of upto $10,000
- Minimum deposit $100
- Verify your account before the bonus is credited
- Fund Moneta Markets account with a minimum of $250
- Opt in using the form to claim your 50% deposit bonus
Learn to Trade
Never Miss A Trade Again

Signal Notification
Real-time signal notifications whenever a signal is opened, closes or Updated

Get Alerts
Immediate alerts to your email and mobile phone.

Entry Price Levels
Entry price level for every signal Just choose one of our Top Brokers in the list above to get all this free.