The rate of change indicator helps you spot how fast prices are moving up or down. Think of it as a speedometer for market prices. When you know how fast prices are changing, you can make smarter trading choices and spot good times to buy or sell.
In this guide, you’ll learn exactly how the ROC works, how to set it up, and how to use it to spot trading signals. By the end, you’ll be able to add this tool to your trading toolkit with confidence.
Understanding the Rate of Change Indicator
The ROC measures how much a price has changed over a set time period, shown as a percentage. Here’s how it works:
- Pick a time period (say 10 days)
- Take today’s closing price
- Find the closing price from 10 days ago
- Calculate: ((Today’s price – Price 10 days ago) / Price 10 days ago) × 100
For example, if Apple stock costs $150 today and cost $120 ten days ago:
ROC = (($150 – $120) / $120) × 100
ROC = ($30 / $120) × 100
ROC = 25%
This tells you Apple’s price grew 25% in 10 days—that’s pretty fast!
When ROC is positive, prices are going up. And when it is negative, prices are falling. The bigger the number (like +25% or -25%), the faster prices are moving.
Unlike other indicators like RSI, the ROC doesn’t have upper or lower limits. It simply shows the speed of price change as a percentage.
How to Set Up and Read the ROC Indicator
Adding ROC to your charts is easy. Here’s how to do it on most trading platforms:
- Open your chart (on TradingView or MT4)
- Find the indicators menu
- Select “Rate of Change” or “ROC”
- Choose your time period (common settings are 9, 14, or 25 days)
Shorter time periods (like 5 or 9 days) work better for short-term trading. Longer periods (like 25 days) help you spot bigger trends.
The ROC shows up as a line below your price chart. The most important part to watch is the zero line. When the ROC crosses above zero, prices are starting to rise. When it drops below zero, prices are starting to fall.
Many traders also watch for extreme readings:
- High ROC values (above +10) might mean prices are rising too fast
- Low ROC values (below -10) might mean prices are dropping too fast
- When ROC reaches extreme levels, prices often reverse soon after
Trading Strategies Using Rate of Change
Here are four ways you can use ROC to find trading opportunities:
1. Zero-Line Crossovers
- Buy when ROC crosses above zero (prices start rising)
- Sell when ROC crosses below zero (prices start falling)
This simple strategy helps you catch new trends early. For example, if the ROC for Bitcoin crosses above zero after being negative for weeks, it might signal the start of a new uptrend.
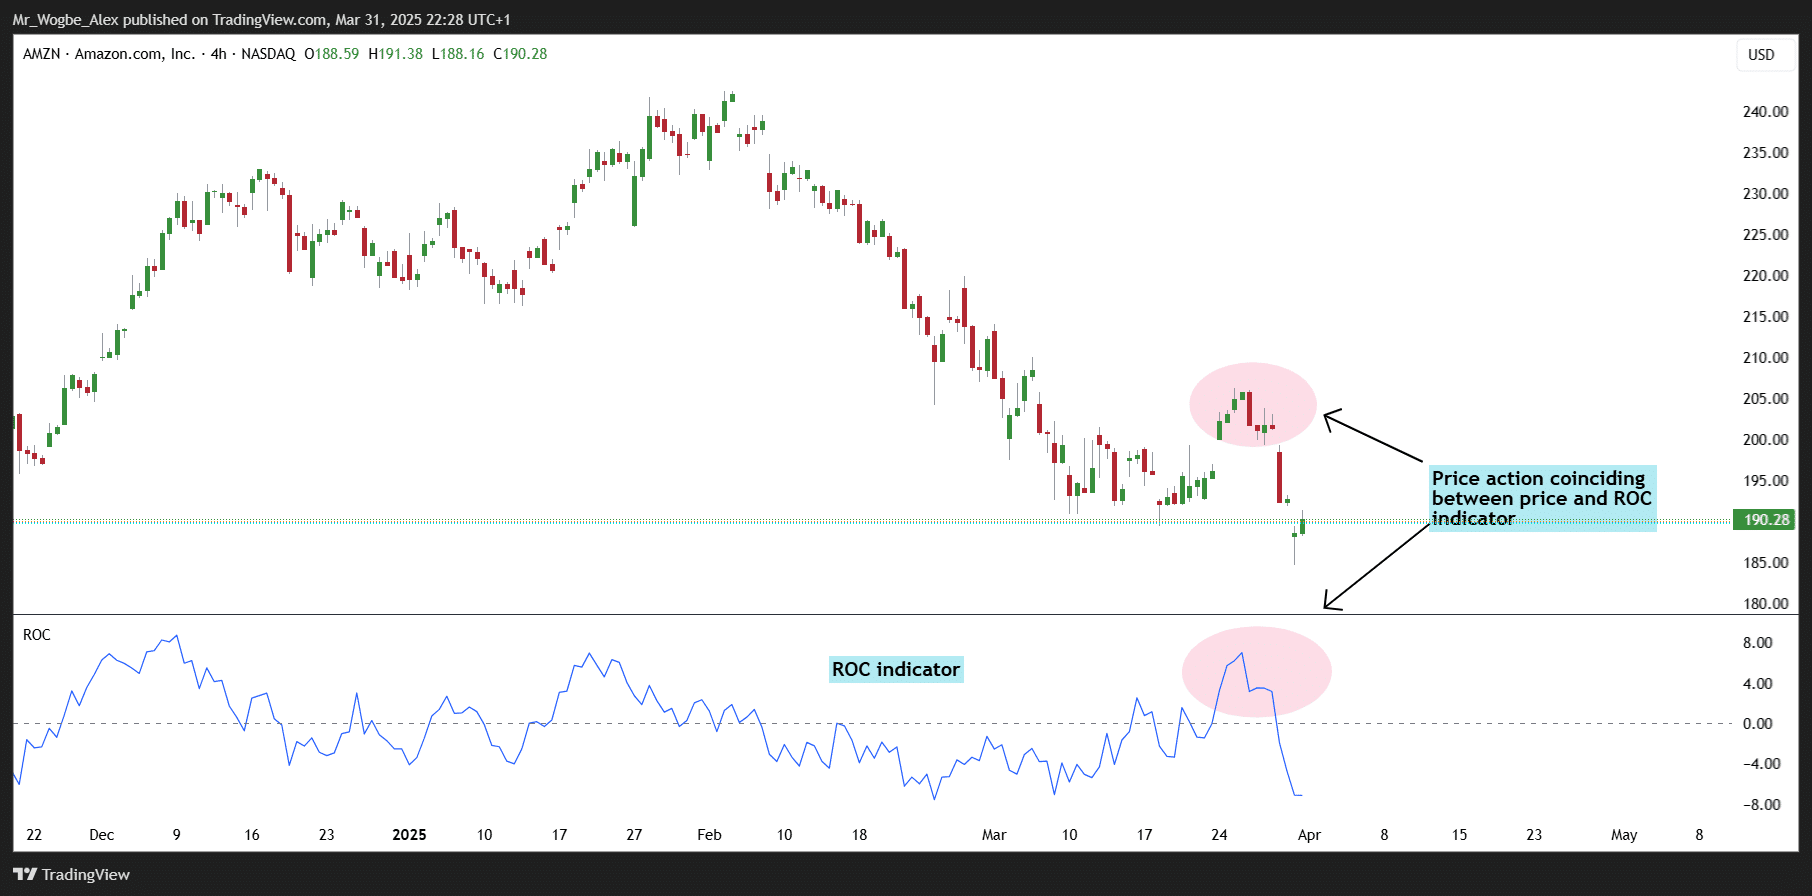
2. Spotting Divergences
Divergence happens when price and ROC move in opposite directions:
- Bullish divergence: Price makes lower lows, but ROC makes higher lows
- Bearish divergence: Price makes higher highs, but ROC makes lower highs
Divergences often signal coming price reversals. If a stock hits new highs but the ROC is lower than before, the uptrend may be losing steam.
3. Trend Strength Checks
- Use ROC to see if a trend is strong or weak:
- Rising ROC = strengthening trend
- Falling ROC = weakening trend
For example, if a stock is rising but the ROC is dropping, the uptrend might be slowing down. This could warn you to take profits soon.
4. Combining with Moving Averages
For stronger signals, combine ROC with a moving average:
- Add a 20-day moving average to your ROC line
- Buy when ROC crosses above its moving average
- Sell when ROC crosses below its moving average
- This helps filter out false signals and catches more reliable trends.
Conclusion
The Rate of Change indicator gives you a clear way to measure price momentum. By watching for zero-line crossovers, divergences, and extreme readings, you can spot potential turning points in the market.
Remember that no indicator works perfectly all the time. The ROC works best when you use it alongside other tools and your own market knowledge.
Start by adding the ROC to your charts with a 14-day setting. Watch how it behaves with your favorite trading pairs or stocks. Soon, you’ll develop a feel for how to use this powerful tool to improve your trading decisions.
Interested In Trading The Market With A Trustworthy Partner? Try Eightcap Today.
- Broker
- Min Deposit
- Score
- Visit Broker

- Award-winning Cryptocurrency trading platform
- $100 minimum deposit,
- FCA & Cysec regulated

- 20% welcome bonus of upto $10,000
- Minimum deposit $100
- Verify your account before the bonus is credited
- Fund Moneta Markets account with a minimum of $250
- Opt in using the form to claim your 50% deposit bonus
Learn to Trade
Never Miss A Trade Again

Signal Notification
Real-time signal notifications whenever a signal is opened, closes or Updated

Get Alerts
Immediate alerts to your email and mobile phone.

Entry Price Levels
Entry price level for every signal Just choose one of our Top Brokers in the list above to get all this free.