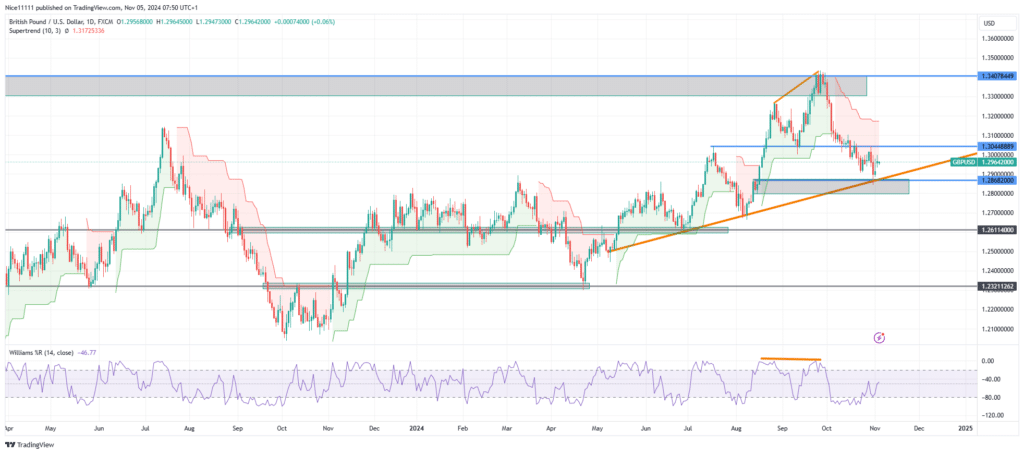
GBPUSD price has been trending downward since its rejection from the resistance zone at 1.34080. The break below the swing low at 1.30450 confirmed a bearish shift, pushing the pair toward a bullish trendline anchored to previous swing lows. The price has now reached a confluence zone, marked by this trendline and a bullish order block, signaling potential support.
Upon reaching the supply zone at 1.34080 in September, the RSI revealed the GBPUSD market weakness. This was evident as a lower high formed in the overbought region, even as the price hit a new high within the resistance zone.
Following this signal, the appearance of the Supertrend red cloud confirmed the bearish trend. In October, the break below 1.30450 reinforced the downward movement, while the formation of a new bearish order block around this area added further selling momentum.
GBPUSD Short-Term Trend: Bearish
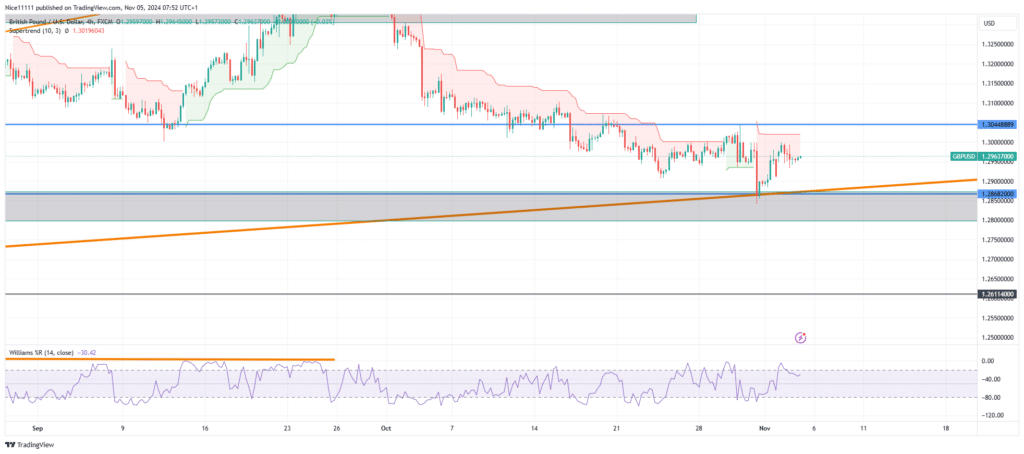
Currently, the price has entered the bullish order block at 1.28680, aligning with the test of the bullish trendline on the daily chart, creating a confluence zone. The strong rejection at this level suggests a possible shift, with bullish structure emerging on lower timeframes. This anticipated shift could offer high-risk-to-reward forex signals for a potential bullish reversal.
Note: Learn2.trade is not a financial advisor. Do your research before investing your funds in any financial asset, product, or event. We are not responsible for your investment results.
Trade on MT4 with Leverage up to 1:500! Trade on MT4 with Leverage up to 1:500!
X
We use cookies to ensure that we give you the best experience on our website. If you continue to use this site we will assume that you are happy with it.