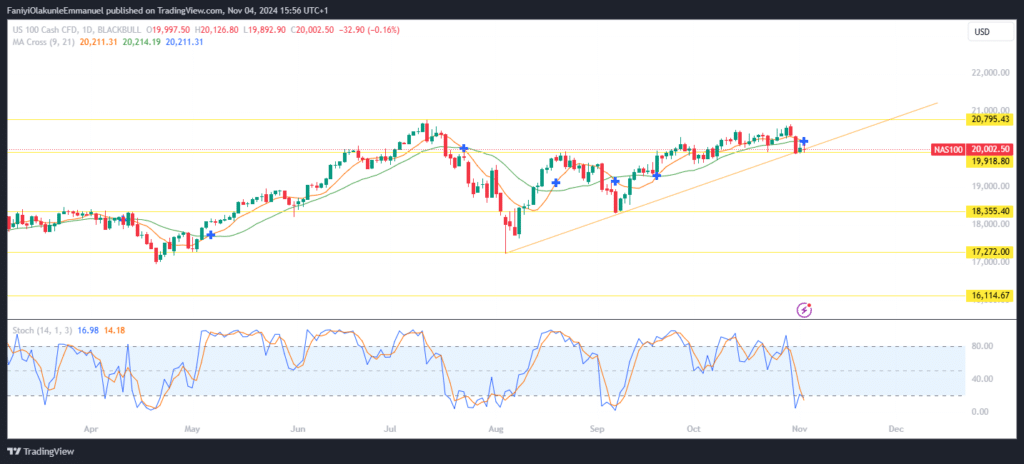
The Nasdaq 100 index is approaching a key moment as it seeks to set a new all-time high. After the close in September, NAS100 fell short of reaching its previous record high of 20,795.0, pulling back as it searches for support within its ongoing bullish trend.
Earlier this year, NAS100’s initial bullish wave reached an all-time high of 20,795.0. Following this peak, the price dropped below the crucial 19,918.0 level, experiencing a retracement that took it under the 30 and 50-period Moving Averages, which had served as key supports.
This downtrend concluded in August, establishing a swing low at 17,272.0. Since then, NAS100 has shown strength, creating higher swing lows as buyers regained control. The index has successfully reclaimed its position above both the 30 and 50 Moving Averages, and it has surged past the 19,918.0 support level.
Nasdaq Long-Term Trend: Bearish
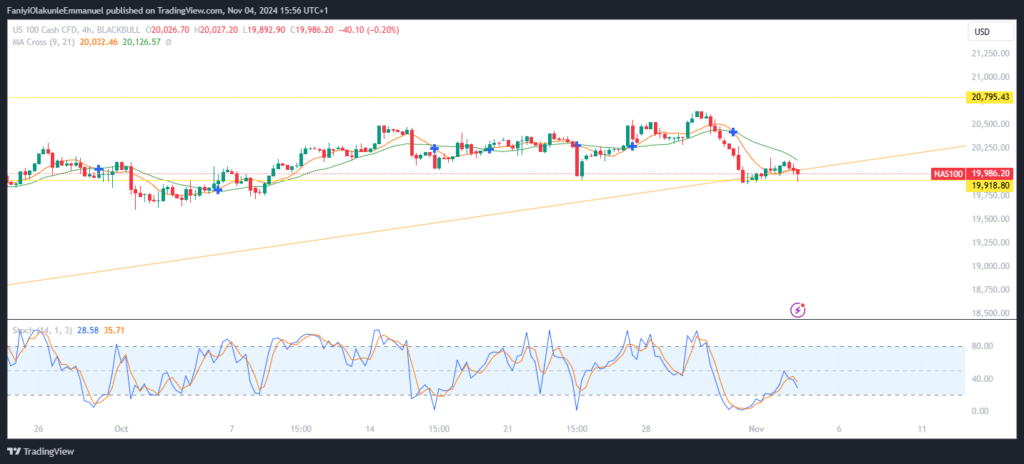
Currently, NAS100 price is testing a bullish trendline anchored on recent lows, reinforcing the ongoing uptrend. The Stochastic indicator suggests a recovery from oversold conditions on the lower timeframes, while higher timeframe readings also indicate an oversold market. This confluence of the bullish trendline test and the key support zone at 19,918.0 positions NAS100 for a potential breakout, which could drive the price to new highs.
With market forex signals suggesting a sustained recovery, the index looks set to challenge previous resistance and explore new territory.
Note: Learn2.trade is not a financial advisor. Do your research before investing your funds in any financial asset, product, or event. We are not responsible for your investment results.
Trade on MT4 with Leverage up to 1:500! Trade on MT4 with Leverage up to 1:500!
X
We use cookies to ensure that we give you the best experience on our website. If you continue to use this site we will assume that you are happy with it.