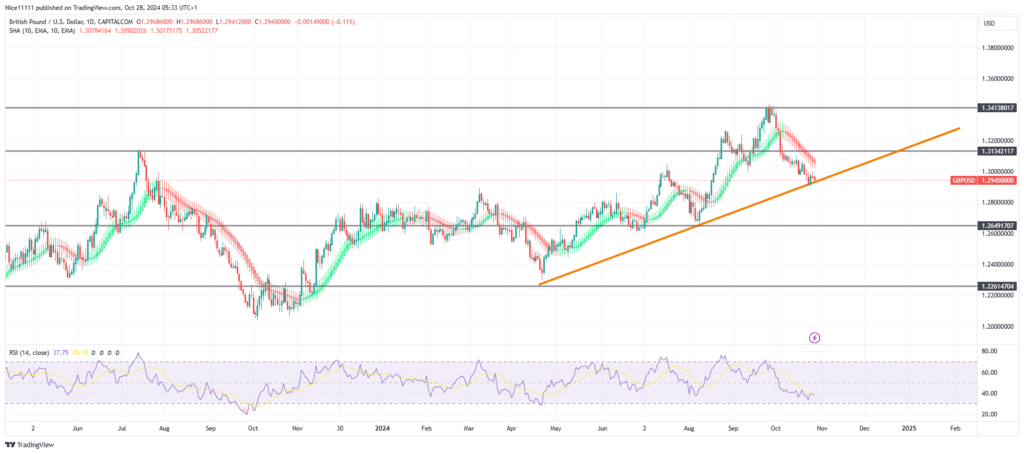
The GBPUSD currency pair continues its downward trajectory, having declined by 3.84% since the market reversal at 1.34290. This significant price movement has breached the last major low established during the bullish trend, indicating a notable shift in market control toward sellers.
At the price point of 1.34290, a divergence was identified on the Relative Strength Index (RSI). Although the GBPUSD market established a new higher high, the RSI registered a lower high, suggesting underlying weakness and signaling buyer exhaustion at this critical level. This divergence is often a precursor to potential reversals, indicating that the buying pressure may not be sufficient to sustain higher prices.
The formation of a swing high at 1.34290 triggered the ongoing price decline. Additionally, the Smoothened Heikin Ashi candles have reconfigured above the custom daily candles, displaying a red hue that further reinforces the bearish outlook. This combination of technical signals suggests a robust bearish momentum that may continue in the near term.
GBPUSD Short-Term Trend: Bearish
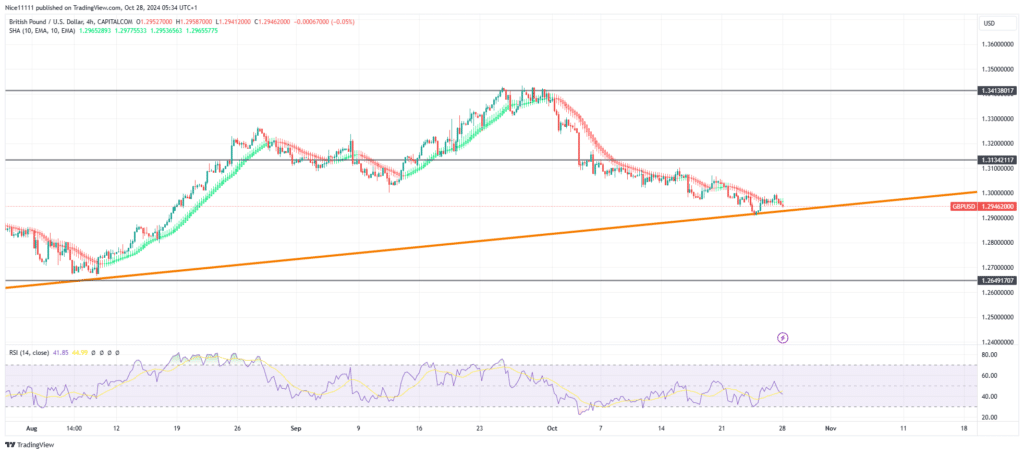
The daily chart reflects a bearish market structure, with prices nearing a bearish order block at 1.28730. A bullish trendline lies just ahead, creating a potential obstacle for the ongoing bearish trend. Both the bullish order block and trendline could impede sellers’ momentum, providing areas of support that may lead to temporary retracements. Should the price successfully break through these critical levels, a further decline towards 1.26730 is anticipated, potentially opening the door for deeper bearish movement in the longer term which will be utilized in forex signals.
Note: Learn2.trade is not a financial advisor. Do your research before investing your funds in any financial asset, product, or event. We are not responsible for your investment results.
Trade on MT4 with Leverage up to 1:500! Trade on MT4 with Leverage up to 1:500!
X
We use cookies to ensure that we give you the best experience on our website. If you continue to use this site we will assume that you are happy with it.