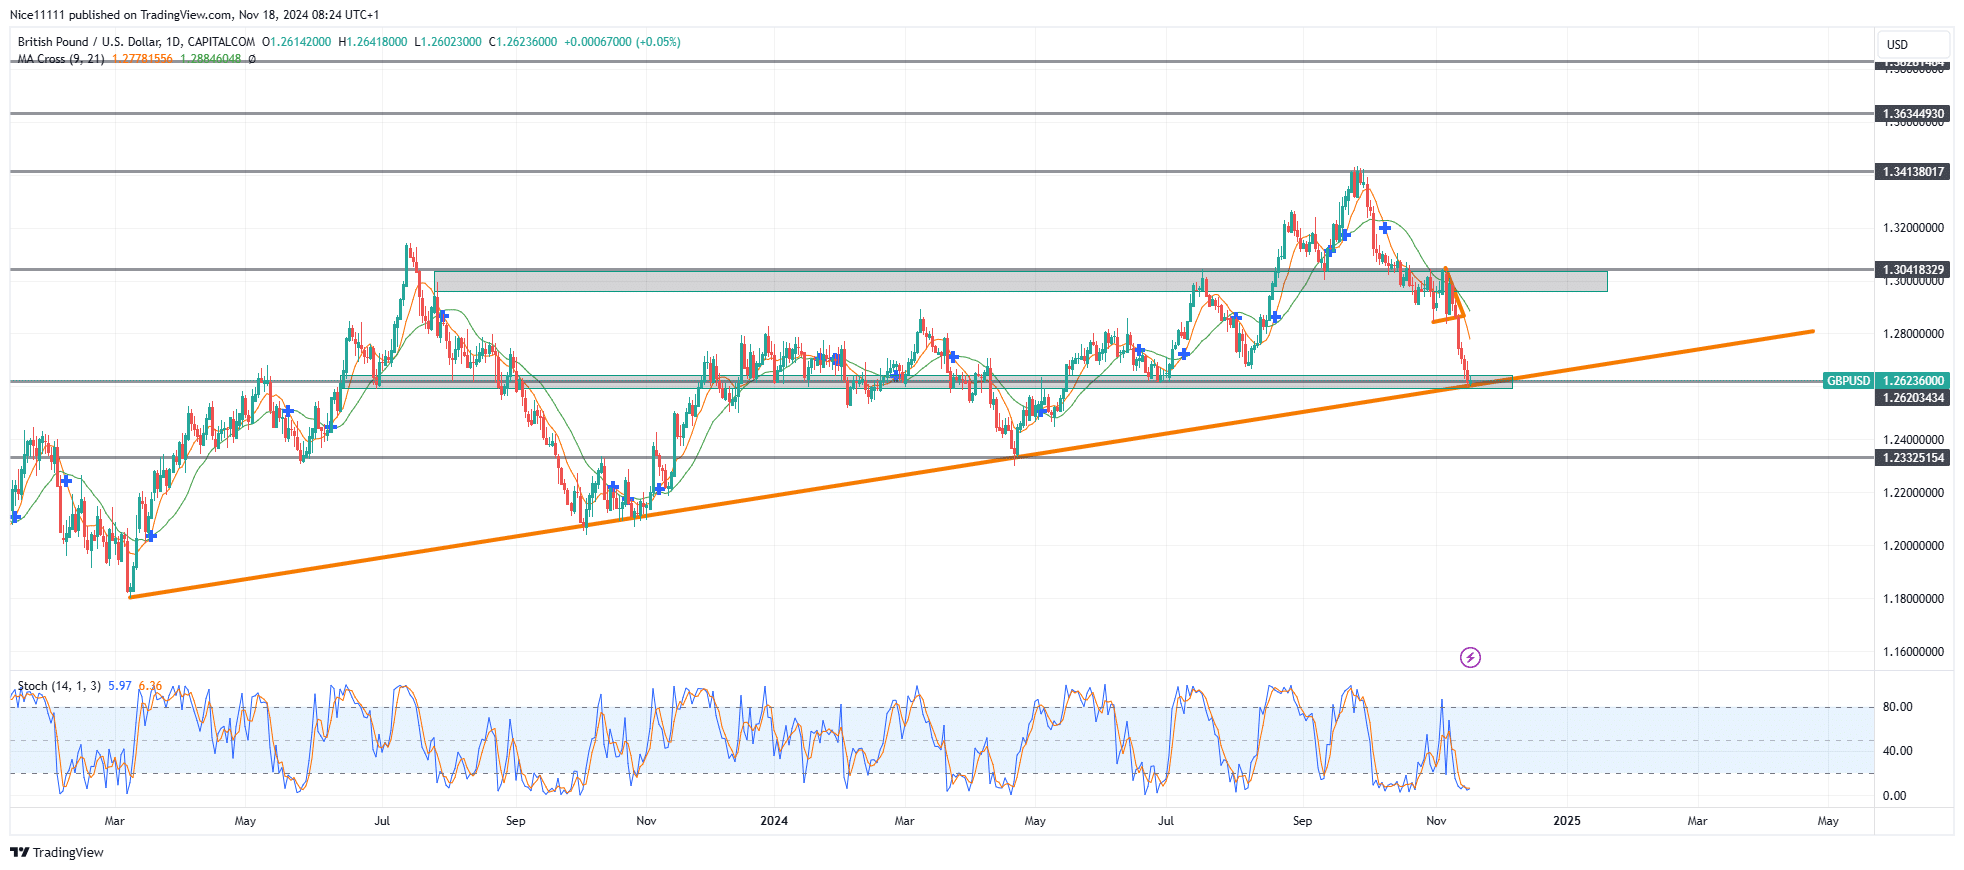
GBPUSD has recently fallen below the 1.30410 demand level, descending to a new support zone at 1.26200. This support zone aligns with a bullish trendline, potentially acting as a buffer against further downside pressure in the ongoing bearish trend.
The break below the 1.30410 demand level has confirmed a bearish phase for GBPUSD. This shift was validated by the 9-period Moving Average crossing below the 21-period Moving Average, marking a bearish reversal that began in September.
The Stochastic indicator reveals oversold conditions, situating the market within a key bullish confluence zone near the 1.26200 support level and the ascending trendline. While the presence of multiple bearish candles indicates sustained selling momentum, the pressure nearing this confluence zone suggests that sellers may be preparing for a breakout attempt.
GBPUSD Short-Term Trend: Bearish
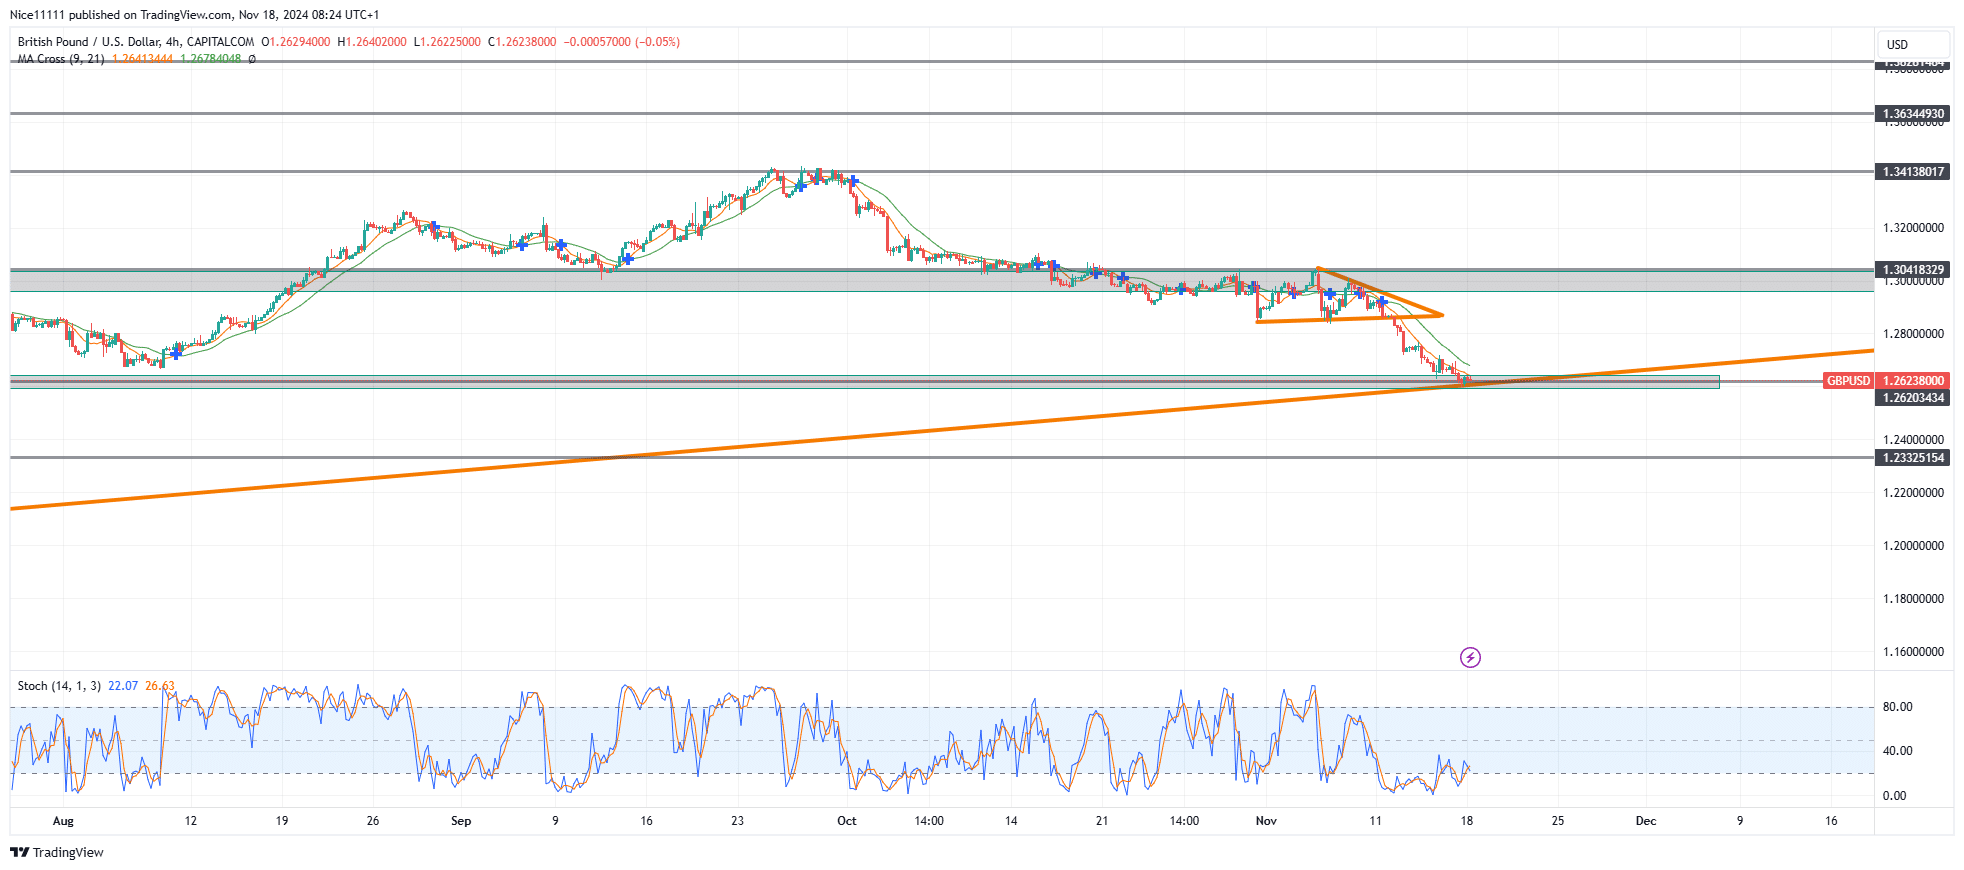
On the 4-hour chart, GBPUSD has entered a re-accumulation phase near the 1.30420 level, where sellers have regained control, driving prices lower. The pair now sits at a critical support point. If bears manage to push below the 1.26200 level, the next target could be the 1.23330 support zone, further reinforcing the bearish outlook.
For traders tracking forex signals, this confluence zone presents a potential pivot point, either for a bearish continuation or a bullish reversal depending on market dynamics.
Note: Learn2.trade is not a financial advisor. Do your research before investing your funds in any financial asset, product, or event. We are not responsible for your investment results.
Trade on MT4 with Leverage up to 1:500! Trade on MT4 with Leverage up to 1:500!
X
We use cookies to ensure that we give you the best experience on our website. If you continue to use this site we will assume that you are happy with it.