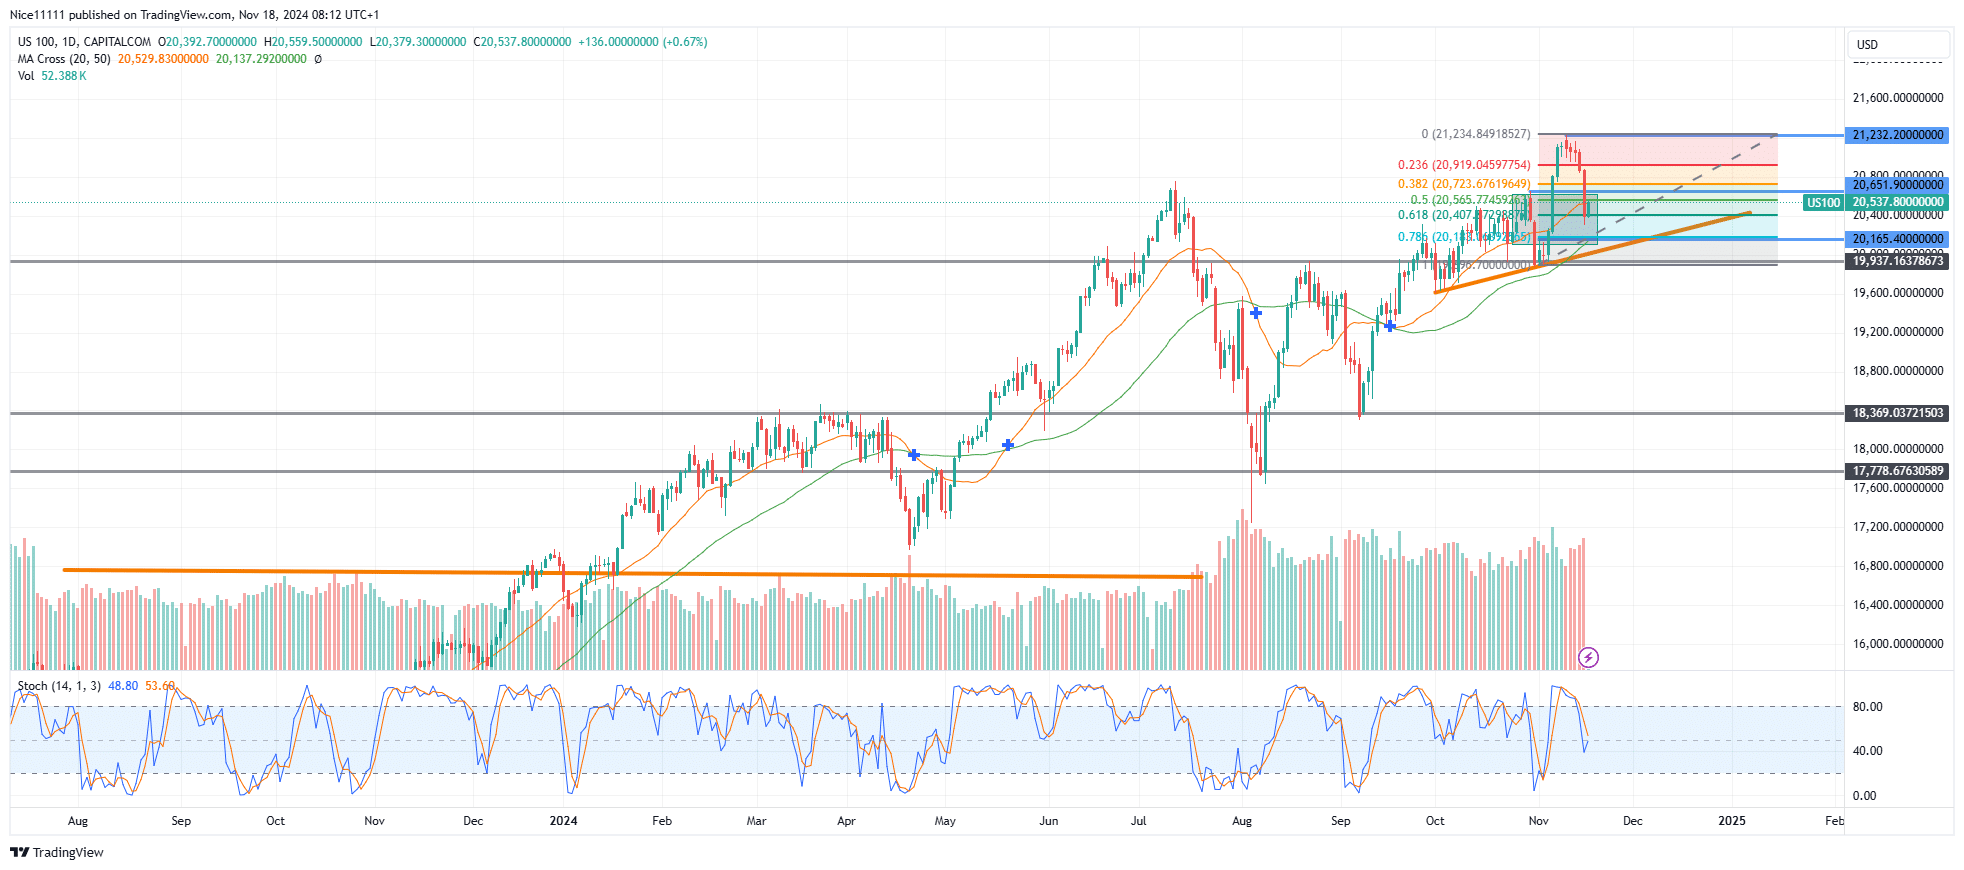
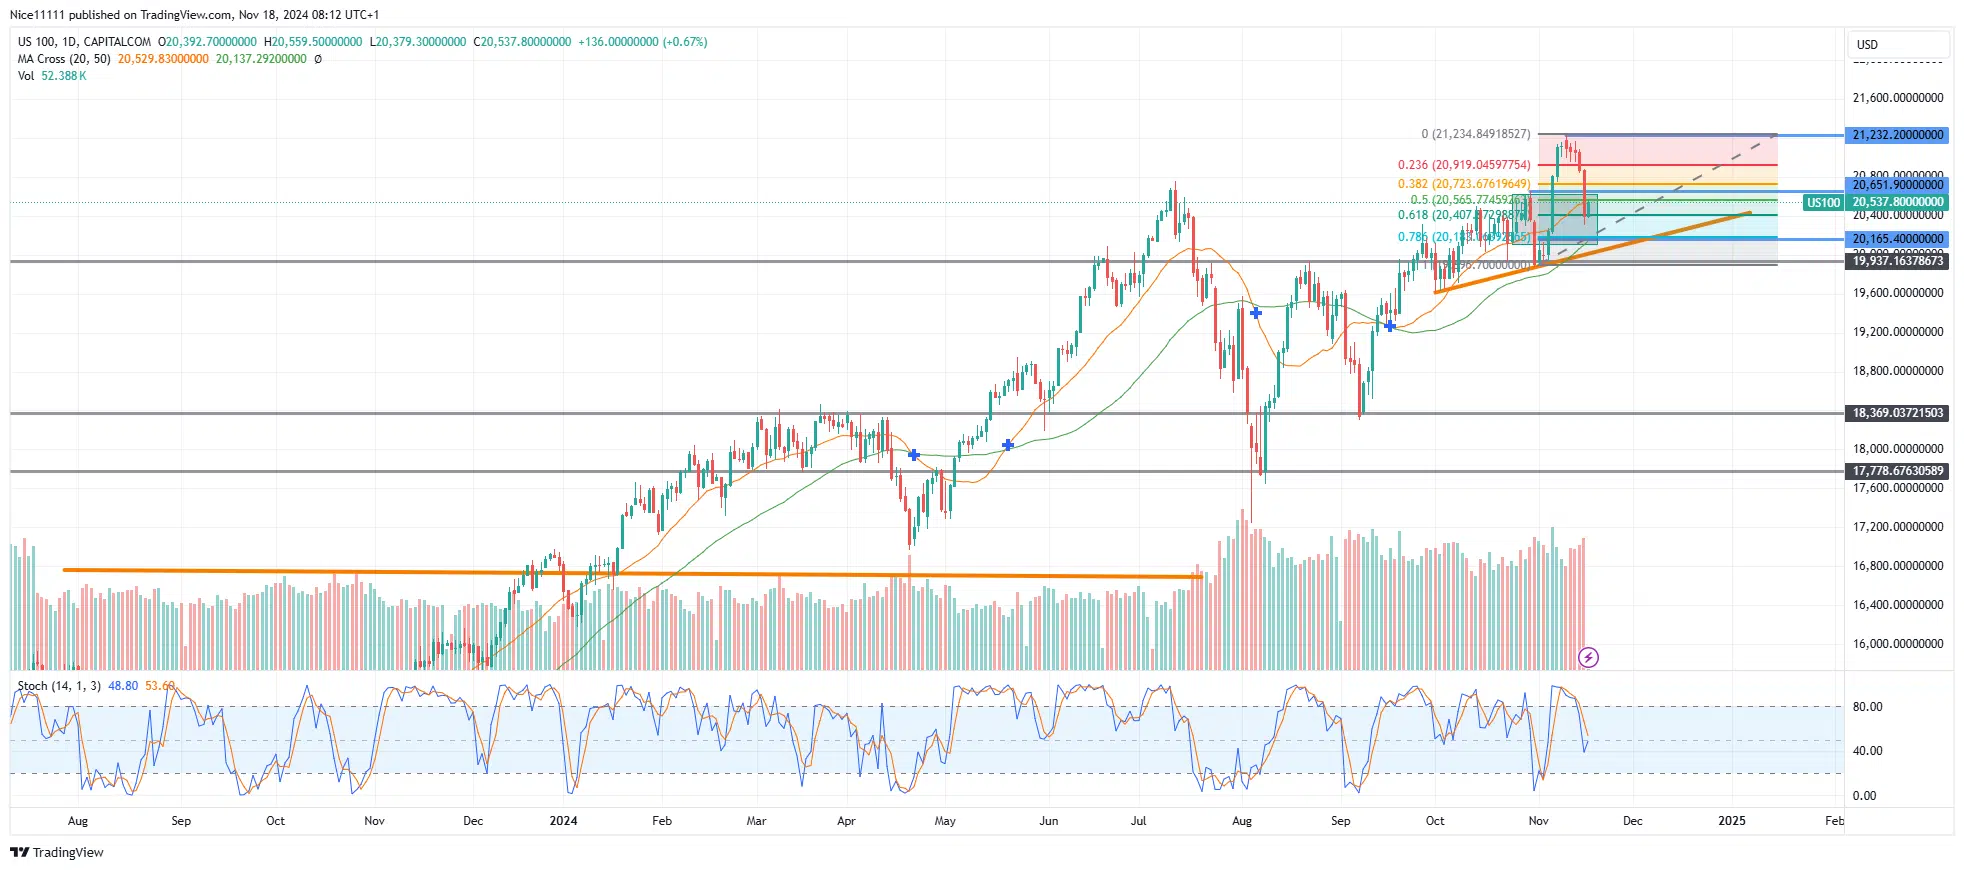
The Nasdaq 100 (NAS100) shows signs of buyer exhaustion after achieving a new all-time high of 21,232.0. The index is currently undergoing a healthy correction within its broader bullish trend. This pullback positions the market in a discount zone, making it an attractive price level for a potential trend continuation. Despite the retracement, the overall market structure remains firmly bullish.
Since forming a swing low at 17,778.0 in August, the Nasdaq 100 has shown consistent growth with increased transaction volume supporting the uptrend. While the price has recently dipped below the 20-period Moving Average, it remains above the 50-period Moving Average, indicating that bullish momentum is still intact.
After reaching a swing high of 21,232.0, the Stochastic indicator highlighted overbought conditions in the market. This prompted a retracement, with the pullback now touching the 61.8% Fibonacci level. This level is considered a critical support zone, often viewed as an optimal entry point within a bullish structure.
Nasdaq 100 Short-term Trend: Bullish
On the 4-hour timeframe, the Nasdaq 100 has moved below its Moving Averages, confirming a lower timeframe bearish movement consistent with the daily chart’s pullback. A trendline has been extended to provide potential support, bolstering expectations for a bullish continuation. The current setup suggests the possibility of a Break of Structure (BOS) as the price gears up for a move toward new highs.
Traders watching for forex signals may also find this retracement level an appealing opportunity to align their strategies with the ongoing bullish trend.
Note: Learn2.trade is not a financial advisor. Do your research before investing your funds in any financial asset, product, or event. We are not responsible for your investment results.
Trade on MT4 with Leverage up to 1:500! Trade on MT4 with Leverage up to 1:500!
X
We use cookies to ensure that we give you the best experience on our website. If you continue to use this site we will assume that you are happy with it.