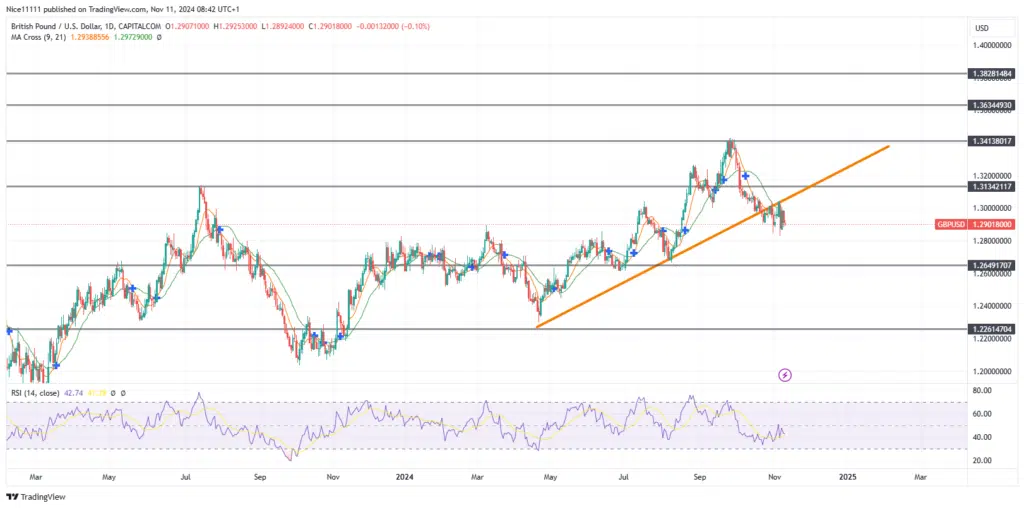
The GBPUSD market entered a consolidation phase from December to March, signaling potential accumulation. A subsequent manipulation phase saw prices dive to the 1.22610 support level. This was followed by a distribution phase, with a strong bullish rally pushing the pair up to 1.34140. However, recent price action shows early signs of a trend reversal, marked by a break below the bullish trendline.
The uptrend in GBPUSD initially began in May, triggered by an oversold Relative Strength Index (RSI) reading. This oversold signal led to a swing low and a Change of Character (ChoCh), initiating a new bullish trend.
In August, a double bottom at the 1.26490 level reinforced the bullish momentum, driving the price up to 1.34140. These swing lows anchored the bullish trendline, providing support. However, the breach of this trendline on the daily chart now suggests a potential market shift toward bearishness.
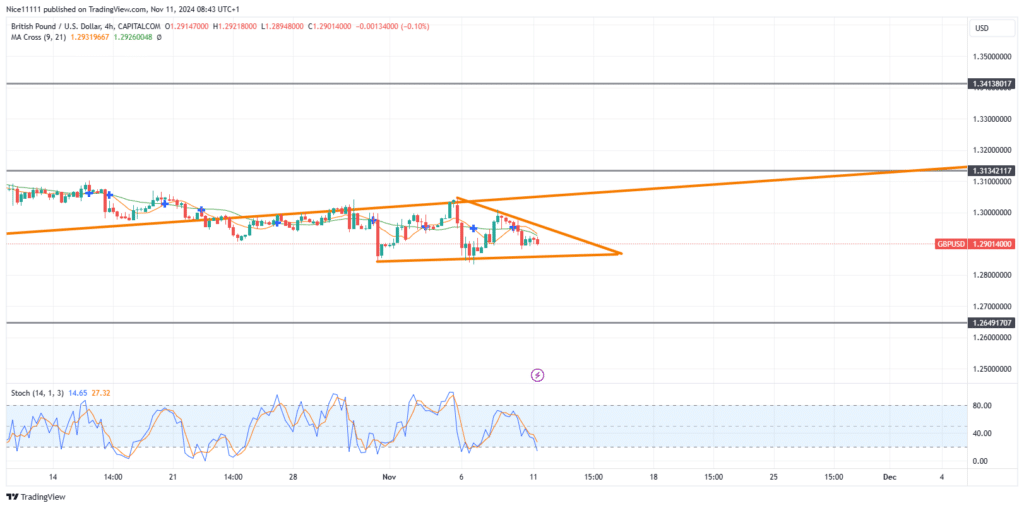
GBPUSD Short-Term Trend: Bearish
On lower timeframes, a clear break and retest of the breached trendline confirm the bearish momentum. Additionally, a descending triangle has formed beneath the trendline on the 4-hour chart. A breakout to the downside from this triangle may offer high-risk-to-reward trade opportunities, targeting a move toward 1.26490. This is a valuable info for traders using crypto signals.
Note: Learn2.trade is not a financial advisor. Do your research before investing your funds in any financial asset, product, or event. We are not responsible for your investment results.
Trade on MT4 with Leverage up to 1:500! Trade on MT4 with Leverage up to 1:500!
X
We use cookies to ensure that we give you the best experience on our website. If you continue to use this site we will assume that you are happy with it.