FTSE 100 Analysis – September 17
FTSE 100 shows weakening momentum amid bearish technical signals. As momentum indicators turn more cautious, the FTSE 100 is displaying a declining bias. With the 9-day Simple Moving Average near $9,240 acting as a dynamic barrier, the index is currently trading around $9,210. After recent attempts to push higher, the RSI is softening near 51, signaling weakening buying pressure. This combination suggests that bullish momentum is fading, potentially leading to further declines.
FTSE 100 Key Levels
Resistance Levels: $9,350, $9,520, $9,700
Support Levels: $8,900, $8,480, $8,110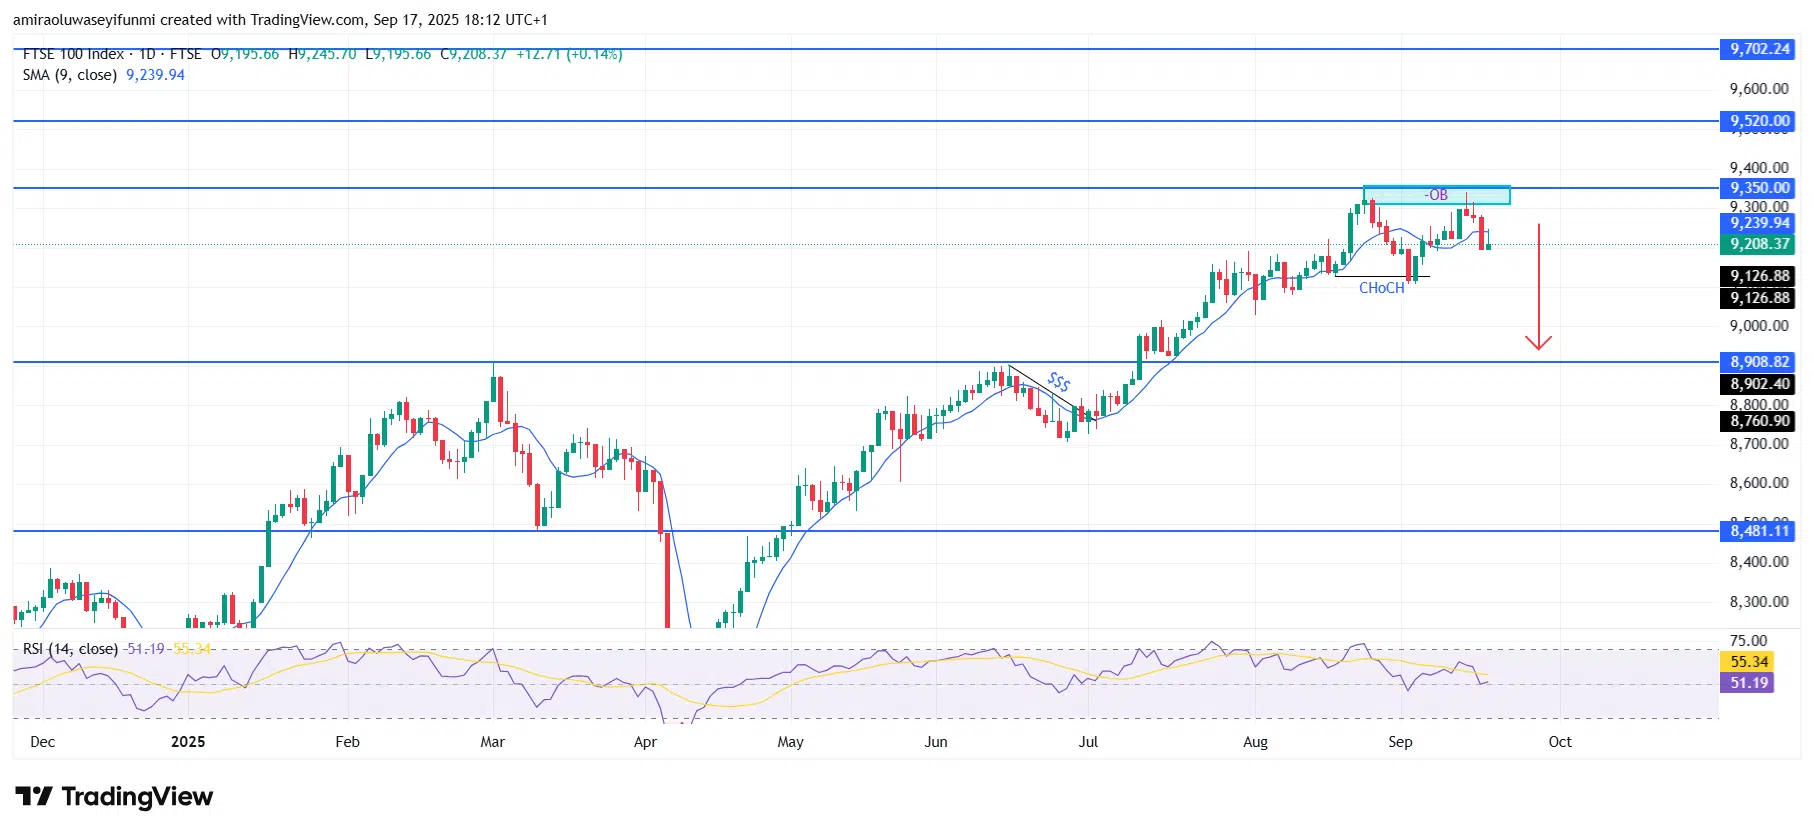
FTSE 100 Long-Term Trend: Bearish
Technically, price action failed to hold above the $9,350 resistance level and recently rejected the order block zone. A clear Change of Character (ChoCH) and the resulting bearish engulfing pattern suggest that sellers are regaining control. Although the $9,130 support level has been tested, market structure still points to a higher likelihood of a decline due to weak buying reactions. The inability to create a higher high confirms the entry into a corrective phase.
If negative momentum strengthens, the index may drop toward the $8,910 level, which aligns with previous demand zones. A deeper retracement could drive prices to the significant historical support area around $8,480. The broader outlook remains biased toward a bearish continuation, with short-term risks tilted to the downside until buyers can reclaim the $9,350 level.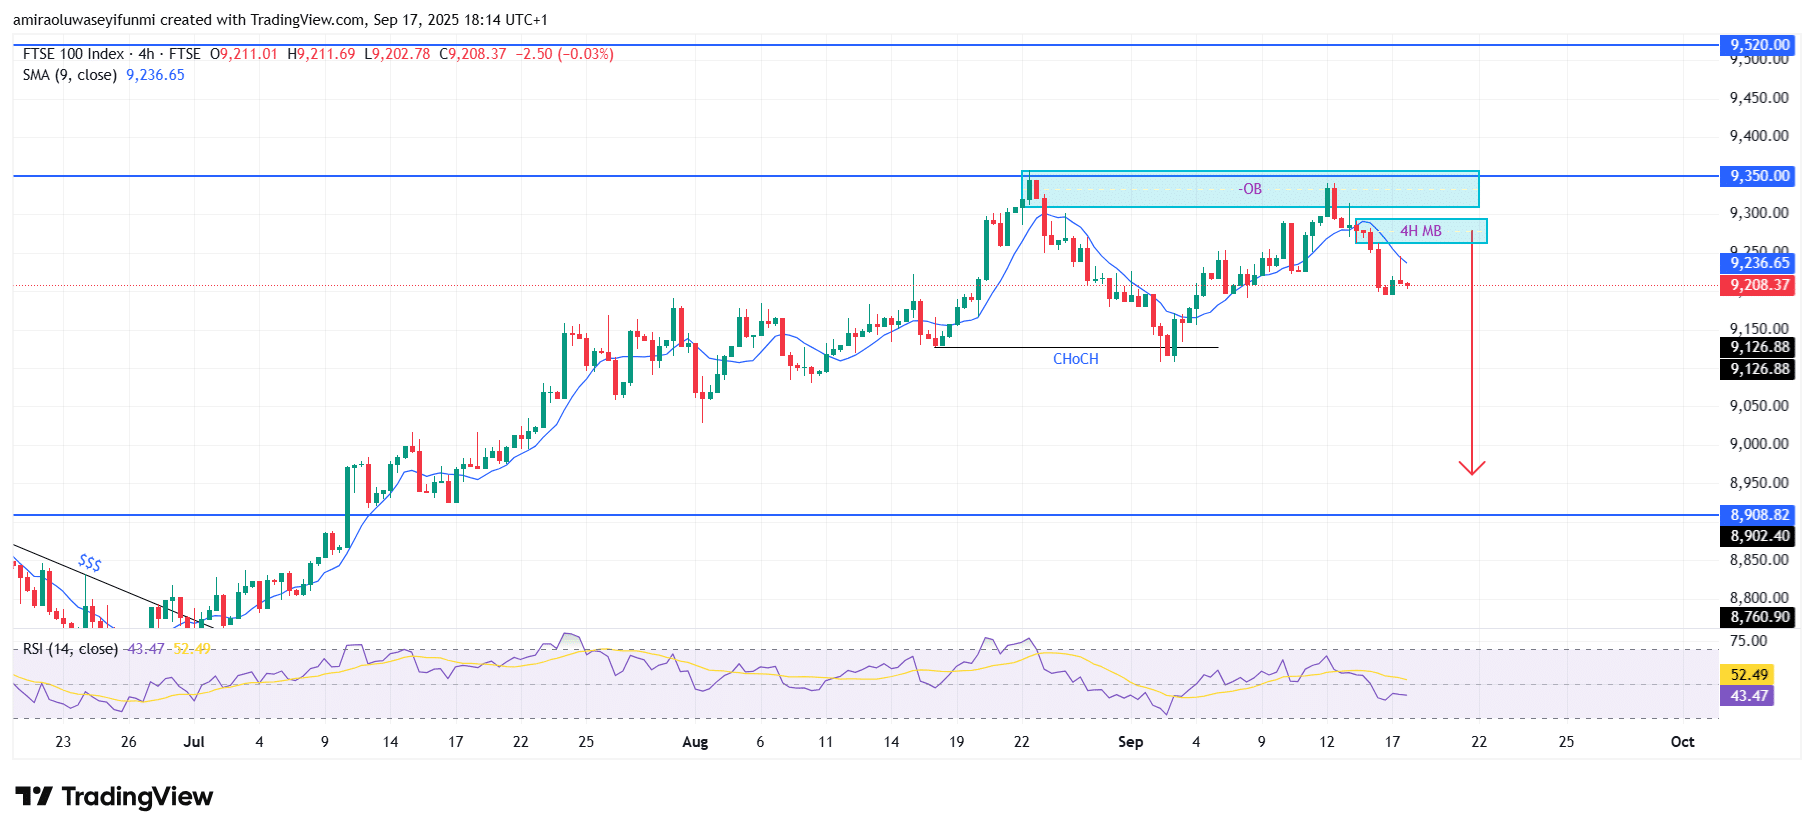
FTSE 100 Short-Term Trend: Bearish
FTSE 100 continues to face bearish pressure after rejecting the $9,350 supply zone. Price is now trading below the 9-day SMA at $9,240, reflecting weak momentum.
The RSI at 43 shows that sellers are regaining control after a failed recovery attempt. A decisive break below $9,130 could accelerate losses toward the $8,910 support region. Traders relying on forex signals may use these levels as a guide for potential entry and exit points in the market.
Make money without lifting your fingers: Start using a world-class auto trading solution
How To Buy Lucky Block
Note: Learn2.trade is not a financial advisor. Do your research before investing your funds in any financial asset, product, or event. We are not responsible for your investment results.
- Broker
- Min Deposit
- Score
- Visit Broker

- Award-winning Cryptocurrency trading platform
- $100 minimum deposit,
- FCA & Cysec regulated

- 20% welcome bonus of upto $10,000
- Minimum deposit $100
- Verify your account before the bonus is credited
- Fund Moneta Markets account with a minimum of $250
- Opt in using the form to claim your 50% deposit bonus
Learn to Trade
Never Miss A Trade Again

Signal Notification
Real-time signal notifications whenever a signal is opened, closes or Updated

Get Alerts
Immediate alerts to your email and mobile phone.

Entry Price Levels
Entry price level for every signal Just choose one of our Top Brokers in the list above to get all this free.