FTSE 100 Analysis – June 18
FTSE 100 is experiencing rejection at an overhead supply block amid weakening momentum. After an extended bullish run, the index now trades just below the $8,900 level, coinciding with the 9-day Simple Moving Average (SMA) at $8,850 and a significant supply zone. The Relative Strength Index (RSI) currently reads 60.65, indicating fading momentum and hinting at possible divergence. With candles closing beneath the SMA and RSI unable to reach overbought territory, the current momentum structure suggests that the recent rally may be losing steam and nearing correction.
FTSE 100 Key Levels
Resistance Levels: $8,900, $9,000, $9,200
Support Levels: $8,480, $8,110, $7,540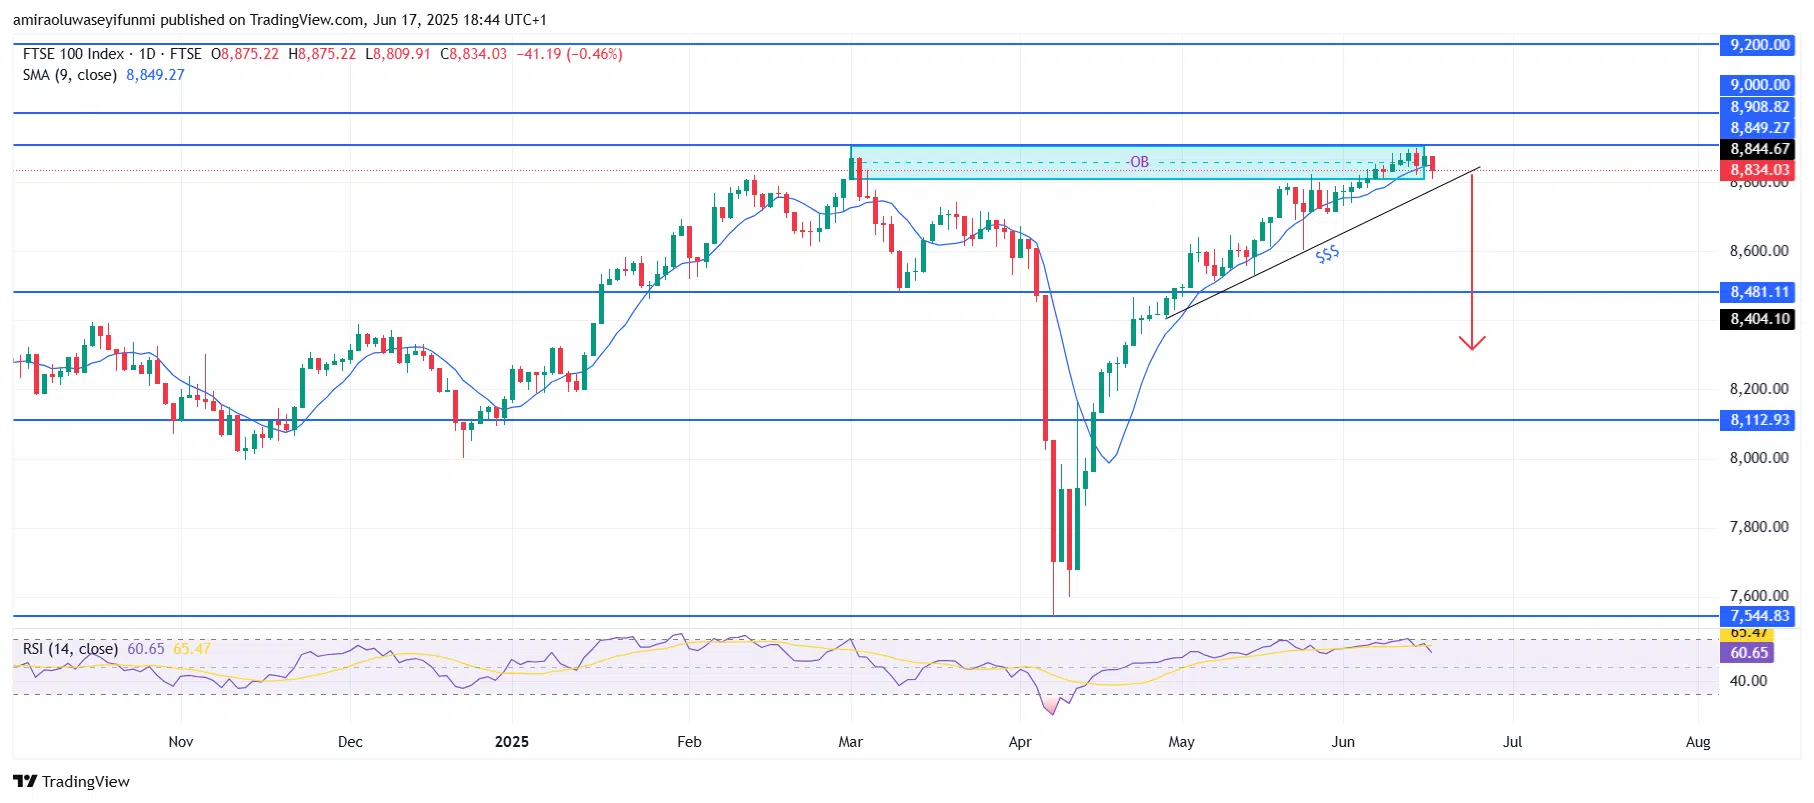
FTSE 100 Long-Term Trend: Bearish
Structurally, the index has been rejected at the $8,900 resistance level, an area previously identified as an order block (OB) likely containing institutional sell orders. The ascending trendline that supported the rally from the April lows is now under threat, and the market’s inability to surpass the $9,000 psychological level reinforces a bearish outlook. Price activity within the supply block, coupled with repeated upper wicks, points more toward distribution than accumulation.
In the short to medium term, FTSE 100 appears set for a bearish retracement, with a likely move down to the $8,480 level. A breakdown below this zone could accelerate losses toward $8,110, a key historical demand level. Considering the fading bullish momentum and current market direction, a further drop to the $7,540 region remains a possibility, especially if macroeconomic factors intensify selling pressure. Traders using forex signals should watch for daily candle closures beneath the trendline as potential confirmation for short entries.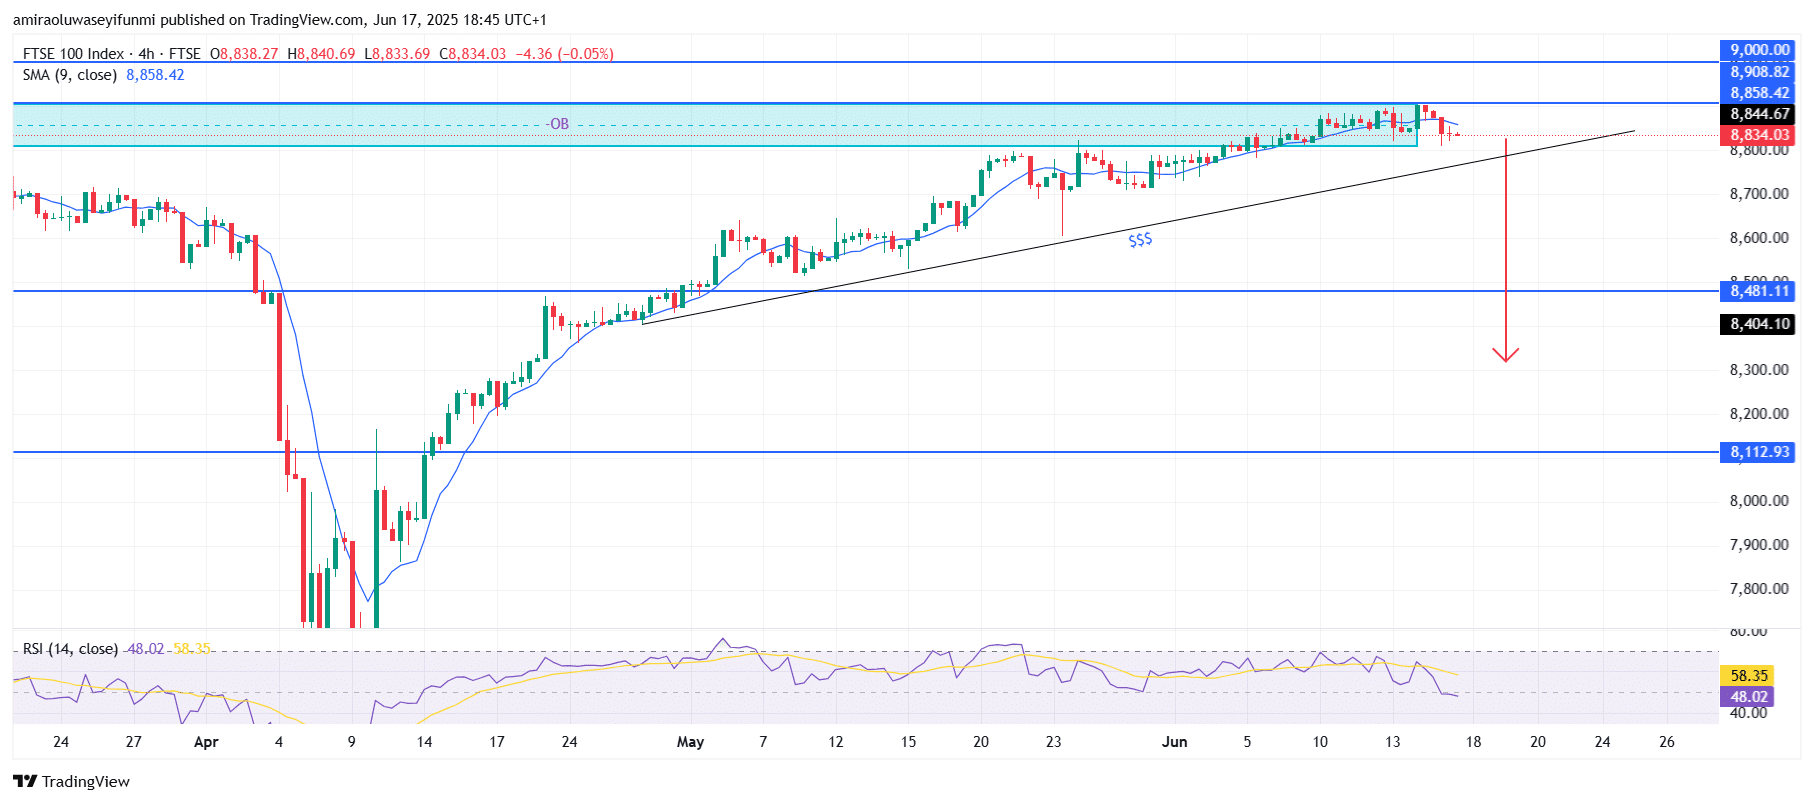
FTSE 100 Short-Term Trend: Bearish
FTSE 100 has failed to break decisively above the $8,900 resistance, with price action now trading below the 9-period SMA and encountering rejection at the supply block. Bearish divergence is confirmed as RSI falls to 48.02 while price remains elevated.
The ascending trendline that has underpinned this bullish phase is weakening, suggesting an impending structural breakdown. A clear move below $8,830 may prompt a rapid decline toward $8,480, with $8,110 as the subsequent downside target.
Make money without lifting your fingers: Start using a world-class auto trading solution
How To Buy Lucky Block – Guide, Tips & Insights | Learn 2 Trade
Note: Learn2.trade is not a financial advisor. Do your research before investing your funds in any financial asset, product, or event. We are not responsible for your investment results.
- Broker
- Min Deposit
- Score
- Visit Broker

- Award-winning Cryptocurrency trading platform
- $100 minimum deposit,
- FCA & Cysec regulated

- 20% welcome bonus of upto $10,000
- Minimum deposit $100
- Verify your account before the bonus is credited
- Fund Moneta Markets account with a minimum of $250
- Opt in using the form to claim your 50% deposit bonus
Learn to Trade
Never Miss A Trade Again

Signal Notification
Real-time signal notifications whenever a signal is opened, closes or Updated

Get Alerts
Immediate alerts to your email and mobile phone.

Entry Price Levels
Entry price level for every signal Just choose one of our Top Brokers in the list above to get all this free.