In case the Bears are able to push the price below the support level of $1.11, then, support level of $1.10 and $1.09 may be tested. Should the just mentioned level is defend by the bulls, the price may continue its bullish trend towards $1.13, $1.14 and $1.16 levels.
EUR/USD Market
Key Levels:
Resistance levels: $1.13, $1.14, $1.16
Support levels: $1.11, $1.10, $1.09
EURUSD Long-term Trend: Bearish
On the long term outlook, EURUSD is bearish. The price action of EURUSD on the daily chart formed a double bottom chart pattern last week. The price reached the support level of $1.11 on November 24, it pulled back and test resistance level of $1.14. The price tested the support level of $1.11 second time on January 28. Today, the price is testing the support level of $1.11 as the third time. Price may bounce up at the just mentioned support level.
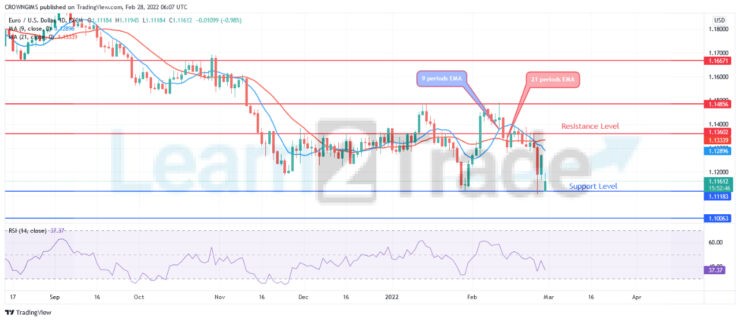
EURUSD has penetrated the two EMA downside, the price is trading below the 21 periods EMA and 9 periods EMA heading towards the previous low of $1.11. In case the Bears are able to push the price below the support level of $1.11, then, support level of $1.10 and $1.09 may be tested. Should the just mentioned level is defend by the bulls, the price may continue its bullish trend towards $1.13, $1.14 and $1.16 levels. However, the Relative Strength index period 14 is at 37 levels pointing down to indicate further price reduction.
EURUSD medium-term Trend: Bearish
EURUSD currency pair remains under the bearish control. The price increase to test the resistance level of $1.14 on February 04. The just mentioned level hold the price and it pulled back to retest the previous low at $1.11. A bullish pin bar formed and the price increased towards the dynamic resistance level. Today, the price experience a gap and it falls to test $1.11 support level third time.
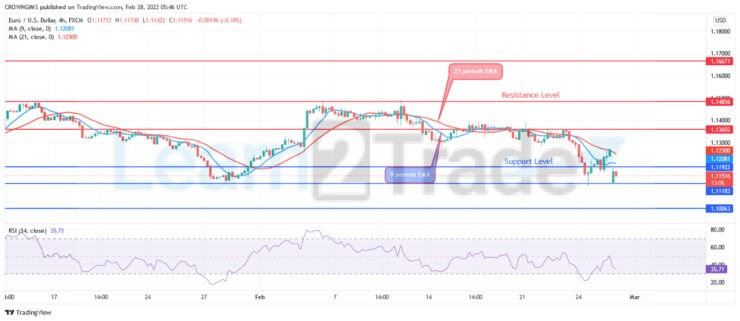
The Relative Strength Index period 14 is at 33 levels with the signal lines pointing up to indicate a buy signal.
- Broker
- Min Deposit
- Score
- Visit Broker

- Award-winning Cryptocurrency trading platform
- $100 minimum deposit,
- FCA & Cysec regulated

- 20% welcome bonus of upto $10,000
- Minimum deposit $100
- Verify your account before the bonus is credited
- Fund Moneta Markets account with a minimum of $250
- Opt in using the form to claim your 50% deposit bonus
Learn to Trade
Never Miss A Trade Again

Signal Notification
Real-time signal notifications whenever a signal is opened, closes or Updated

Get Alerts
Immediate alerts to your email and mobile phone.

Entry Price Levels
Entry price level for every signal Just choose one of our Top Brokers in the list above to get all this free.