LBLOCK Market Forecast – February 28
LBLOCK market forecast is for the coin to retain its grip at the $0.00569450 critical level, from where it will push for more upside movement.
Lucky Block – Guide, Tips & Insights | Learn 2 Trade Long-Term Trend: Bullish (30-Minute Chart)
Critical Levels:
Market Supply Zones: $0.00675750, $0.00746260
Market Demand Zones: $0.00522780, $0.00569450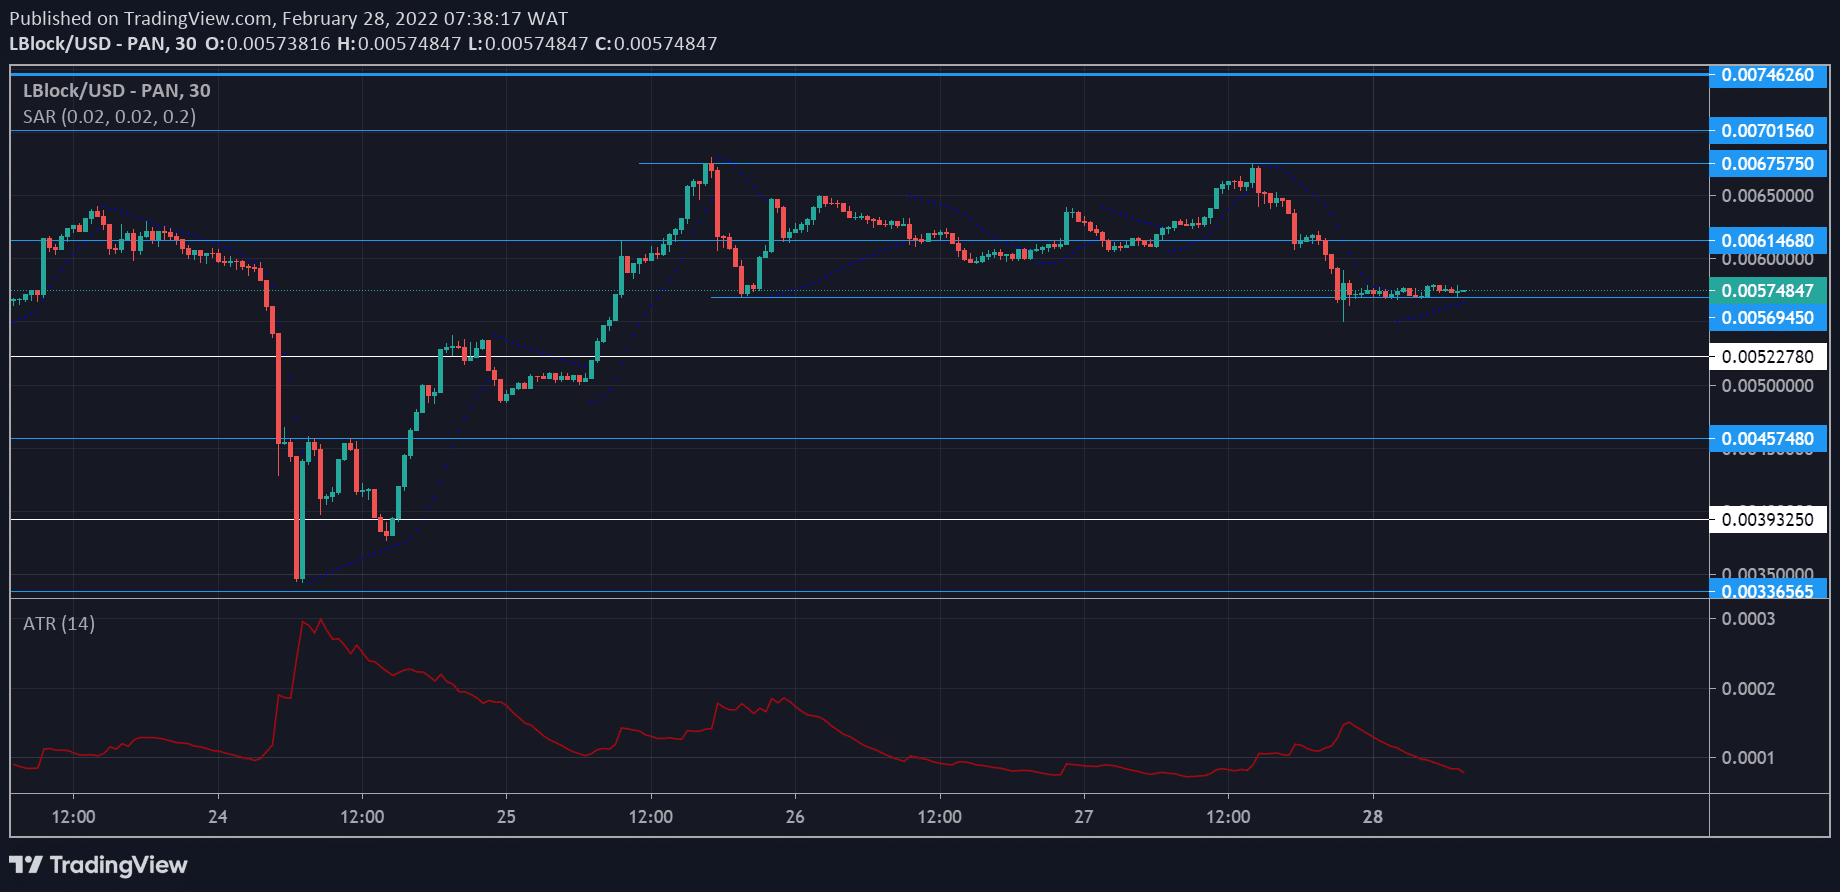
LBLOCK/USD Market Forecast: What Next for LBlock?
Lucky Block – Guide, Tips & Insights | Learn 2 Trade is now recovering from the price dip of February 24th, which happened with much volatility. The first step was to accumulate between key levels before surging above $0.00522780.
A slight fluctuation occurred at this level before the price pushed further upward. The market will have to cross a new barrier at $0.00675750, tested twice without successfully breaking through. Lblock is currently holding above $0.00569450 for a potential market rally.
The ATR (Average True Range) indicator shows that market volatility has been at a low level despite the upward push. However, the Parabolic SAR (Stop and Reverse) suggests that the market is still positioned for a pump as it aligns its dots below the daily candles.
Lucky Block – Guide, Tips & Insights | Learn 2 Trade Medium-Term Trend: Bullish (5-minute chart)
The 5-minute chart shows that the market remains tenacious in holding above the $0.00569450 fundamental level. When the price dropped from an unsuccessful retest of the $0.00675750 fundamental level, it initially dropped below $0.00569450 but then surged above it with increased volatility.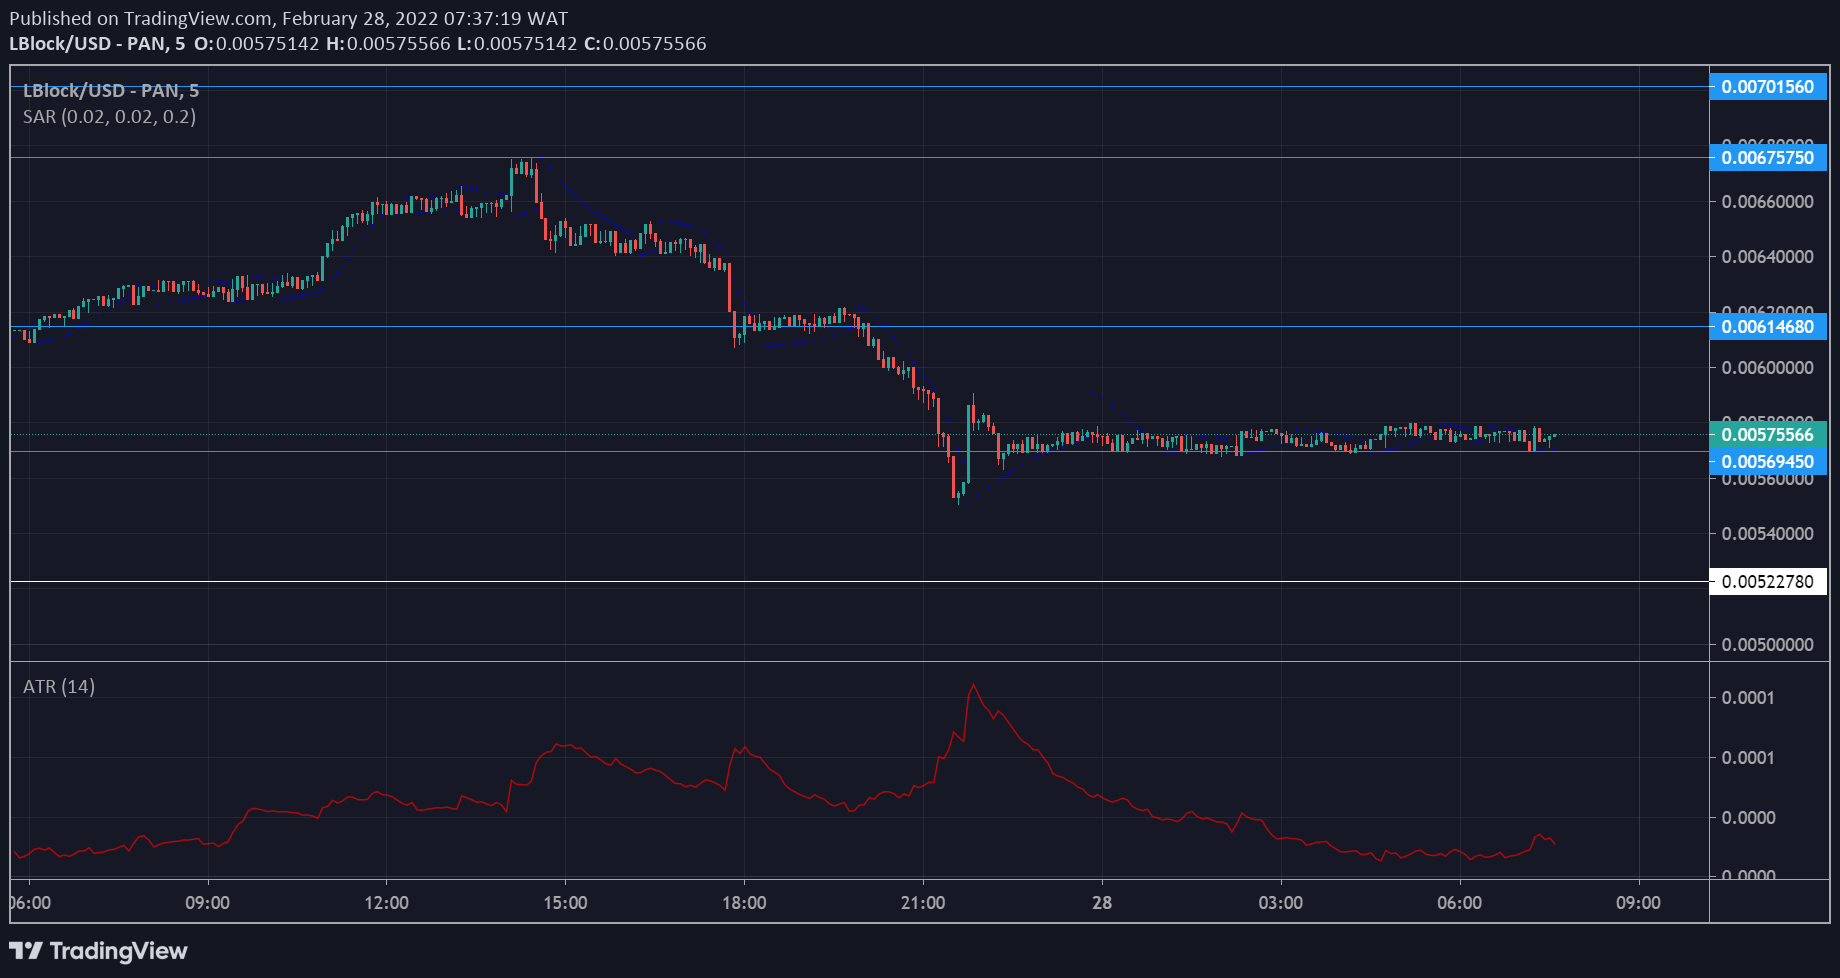
How To Buy Lucky Block – Guide, Tips & Insights | Learn 2 Trade
Note: Learn2.trade is not a financial advisor. Do your research before investing your funds in any financial asset or presented product or event. We are not responsible for your investing results.
- Broker
- Min Deposit
- Score
- Visit Broker

- Award-winning Cryptocurrency trading platform
- $100 minimum deposit,
- FCA & Cysec regulated

- 20% welcome bonus of upto $10,000
- Minimum deposit $100
- Verify your account before the bonus is credited
- Fund Moneta Markets account with a minimum of $250
- Opt in using the form to claim your 50% deposit bonus
Learn to Trade
Never Miss A Trade Again

Signal Notification
Real-time signal notifications whenever a signal is opened, closes or Updated

Get Alerts
Immediate alerts to your email and mobile phone.

Entry Price Levels
Entry price level for every signal Just choose one of our Top Brokers in the list above to get all this free.