Key Highlights
Ethereum reaches the high of $1,434 but pulled back
Ether holds above $1,240 support.
Ethereum ETH) Current Statistics
The current price: $1,331.34
Market Capitalization: $152,216,727,645
Trading Volume: $45,453,349,265
Major supply zones: $1,500, $1,600, $1,300
Major demand zones: $600, $500, $400
Ethereum (ETH) Price Analysis January 20, 2020
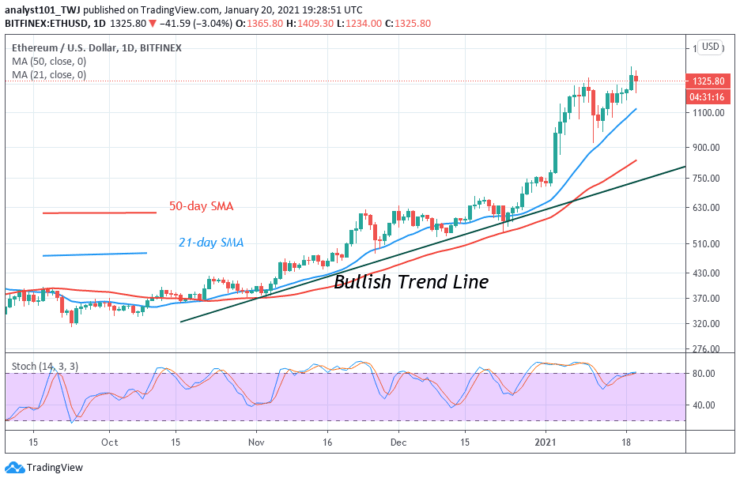
Ethereum bulls have taken a giant stride as price broke the previous resistance to reach a new high of $1,434. Unfortunately, the upward move was interrupted as Ether declines to $1,240 support. The biggest altcoin has resumed upward move. Ether is rising to retest the high of $1,434. On the upside, if price breaks the resistance at $1,434, the crypto will rally above the next target price of $1,675. However, if the bears break below $1,240, the coin will slump to either $1,010 or $900.
ETH Technical Indicators Reading
Ethereum is above 70% range of the daily stochastic. It indicates that the coin is in a bullish momentum. The 21-day SMA and 50-day SMA are pointing upward indicating the uptrend. The 21-day SMA provides the support level for price movement.
Conclusion
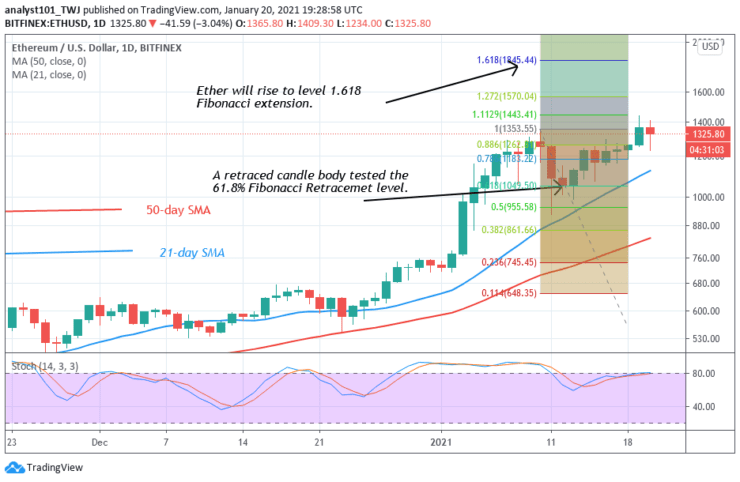
Ethereum is making positive moves as it approaches the Fibonacci target price level. On January 10 uptrend; a retraced candle body tested the 61.8% Fibonacci retracement level. It indicates that the market will rise to level 1.618 Fibonacci extensions or the high of $1,845.44
Note: Learn2.Trade is not a financial advisor. Do your research before investing your funds in any financial asset or presented product or event. We are not responsible for your investing
- Broker
- Min Deposit
- Score
- Visit Broker

- Award-winning Cryptocurrency trading platform
- $100 minimum deposit,
- FCA & Cysec regulated

- 20% welcome bonus of upto $10,000
- Minimum deposit $100
- Verify your account before the bonus is credited
- Fund Moneta Markets account with a minimum of $250
- Opt in using the form to claim your 50% deposit bonus
Learn to Trade
Never Miss A Trade Again

Signal Notification
Real-time signal notifications whenever a signal is opened, closes or Updated

Get Alerts
Immediate alerts to your email and mobile phone.

Entry Price Levels
Entry price level for every signal Just choose one of our Top Brokers in the list above to get all this free.