Key Highlights
Ether battles minor resistance at $1,245 and $1,285
A break above $1,320 will accelerate price movement.
Ethereum ETH) Current Statistics
Major supply zones: $1,100, $!,200, $1,300
Major demand zones: $600, $500, $400
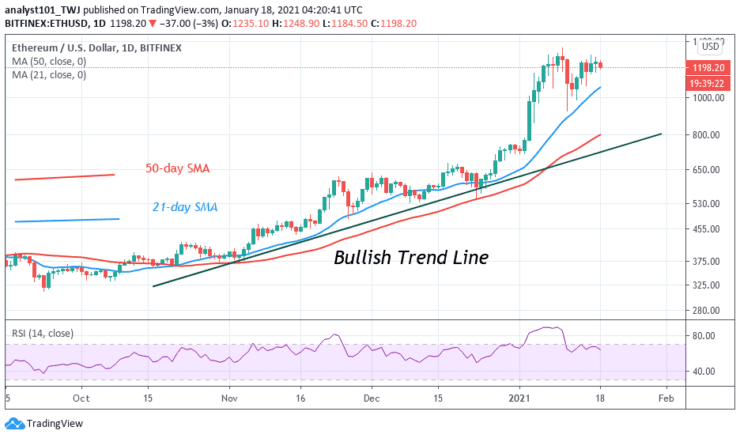
Ethereum (ETH) Price Analysis January 18, 2020
Ethereum is still fluctuating below the $1,300 resistance zone. Buyers have failed to push the coin above the $1,300 resistance since January 14. The upward moves are being repelled either at $1,245 or $1,285 price level. At each resistance, the market will fall to either $1,125 or $1.175 low. Today, Ether is trading at $1,201 at the time of writing. A strong bounce above $1,200 will propel the price to break the minor resistance at $1,245 and $1,285. The bullish momentum will extend to break the resistance at $1,300.
ETH Technical Indicators Reading
Ethereum is at level 63 of the Relative Strength Index period 14. The coin is in the uptrend zone and above the centerline 50. The coin is likely to rise. The crypto’s price is above the SMAs which suggests an upward movement of the coin.
Conclusion
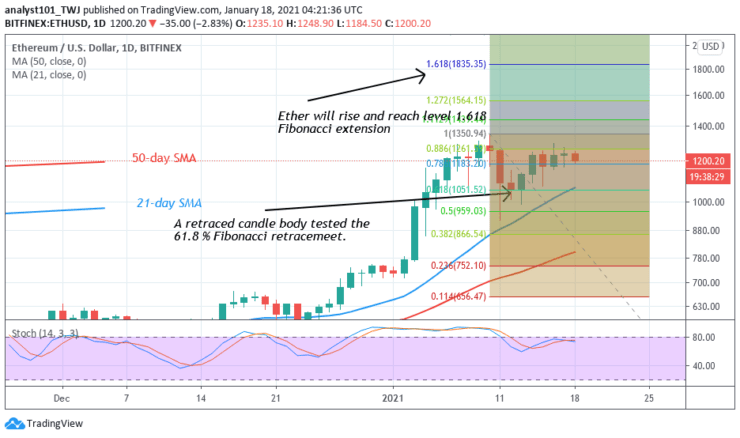
Ethereum’s upward move is being hindered at the $1,306 resistance level. A break above the resistance will accelerate price movement. On January 9 uptrend; a retraced candle body tested the 61.8% Fibonacci retracement level. It indicates that the market will rise to level 1.618 Fibonacci extensions or the high of $1,835.35
Note: Learn2.Trade is not a financial advisor. Do your research before investing your funds in any financial asset or presented product or event. We are not responsible for your investing
- Broker
- Min Deposit
- Score
- Visit Broker

- Award-winning Cryptocurrency trading platform
- $100 minimum deposit,
- FCA & Cysec regulated

- 20% welcome bonus of upto $10,000
- Minimum deposit $100
- Verify your account before the bonus is credited
- Fund Moneta Markets account with a minimum of $250
- Opt in using the form to claim your 50% deposit bonus
Learn to Trade
Never Miss A Trade Again

Signal Notification
Real-time signal notifications whenever a signal is opened, closes or Updated

Get Alerts
Immediate alerts to your email and mobile phone.

Entry Price Levels
Entry price level for every signal Just choose one of our Top Brokers in the list above to get all this free.