Key Highlights
Ethereum bulls break the $1,440 overhead resistance
Ethereum reaches the high of $1,631
Ethereum ETH) Current Statistics
The current price: $1,631.78
Market Capitalization: $186,876,194,143
Trading Volume: $41,432,452,520
Major supply zones: $1,500, $1,600, $1,700
Major demand zones: $600, $500, $400
Ethereum (ETH) Price Analysis February 3, 2020
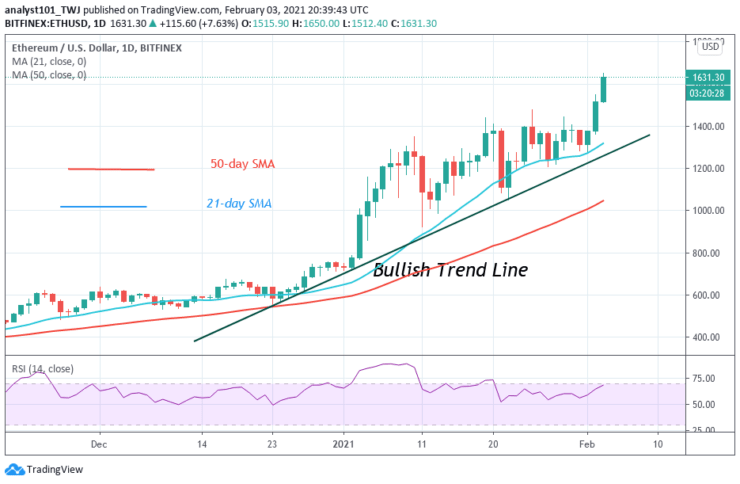
On February 2, Ethereum bulls broke the $1,440 resistance as the price rallied above $1,600 high. The $1,440 resistance has been holding since January 19. The recent breakout has accelerated price movement on the upside. Ether will attain the next target price of $1,675. Ether will reach the high of $2000 if the current bullish momentum is sustained. However, the upward move is doubtful as to the daily stochastic and the RSI has reached the overbought region of the market.
ETH Technical Indicators Reading
The crypto price has risen to level 78 of the Relative Strength Index period 14. It indicates that the crypto is in an overbought region. The coin has no room to rally on the upside. The coin is also above the 80% range of the daily stochastic. The coin is in an overbought region and a bullish momentum.
Conclusion
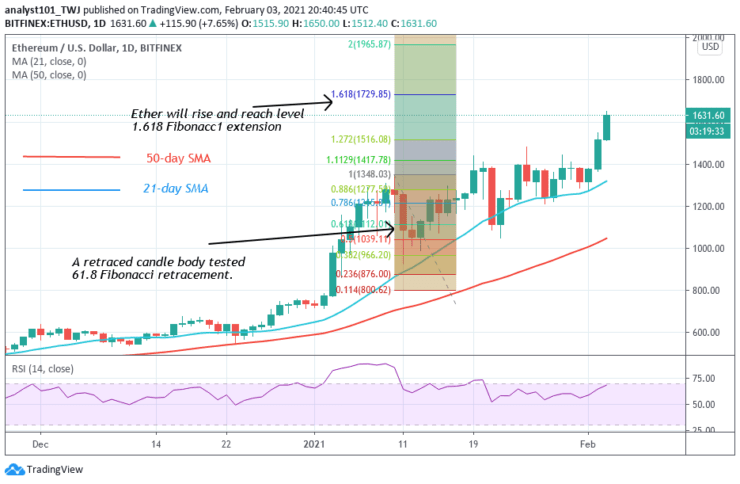
The price has broken the overhead resistance at $440. The Fibonacci tool analysis will hold as the upside momentum resumes. On January 10 uptrend; a retraced candle body tested the 61.8% Fibonacci retracement level. It indicates that the market will rise to level 1.618 Fibonacci extensions or the high of $1,1729.85,
Note: Learn2.Trade is not a financial advisor. Do your research before investing your funds in any financial asset or presented product or event. We are not responsible for your investing
- Broker
- Min Deposit
- Score
- Visit Broker

- Award-winning Cryptocurrency trading platform
- $100 minimum deposit,
- FCA & Cysec regulated

- 20% welcome bonus of upto $10,000
- Minimum deposit $100
- Verify your account before the bonus is credited
- Fund Moneta Markets account with a minimum of $250
- Opt in using the form to claim your 50% deposit bonus
Learn to Trade
Never Miss A Trade Again

Signal Notification
Real-time signal notifications whenever a signal is opened, closes or Updated

Get Alerts
Immediate alerts to your email and mobile phone.

Entry Price Levels
Entry price level for every signal Just choose one of our Top Brokers in the list above to get all this free.