Key Highlights
Ethereum consolidates above $1,300
Ether has strong buying pressure above $1,200
Ethereum ETH) Current Statistics
The current price: $1,316.62
Market Capitalization: $151,910,683,082
Trading Volume: $27,636,629,137
Major supply zones: $1,500, $1,600, $1,700
Major demand zones: $600, $500, $400
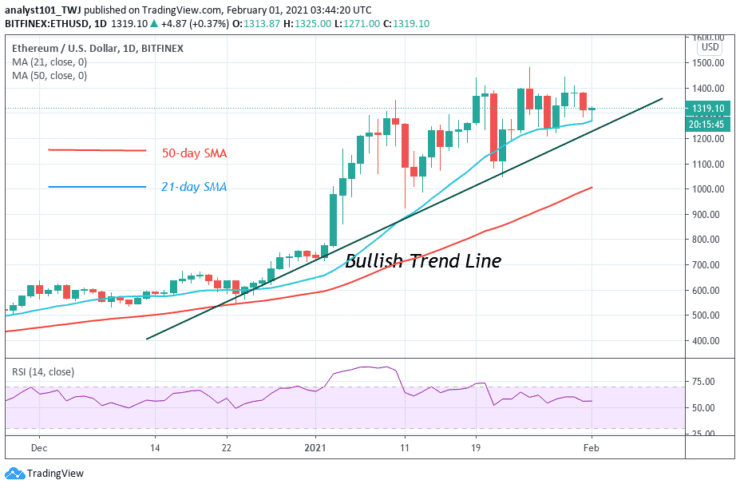
Ethereum (ETH) Price Analysis February 1, 2020
For the past week, Ethereum is trading between $1,200 and $1,440. The price action is characterized by small body indecisive candlesticks like Doji and Spinning tops. The appearance of these candlesticks will mean that the biggest altcoin will consolidate above the current support. It indicates that buyers and sellers are undecided about the direction of the market. On the upside, if the price breaks the $1,440 resistance, Ether will attain a new target price of $1,675. On the other hand, the market will continue to fluctuate between $1,200 and $1,440 if the range-bound levels remain unbroken.
ETH Technical Indicators Reading
Ethereum has fallen to level 46 of the Relative Strength Index period 14. The crypto is in the downtrend zone and it is capable of falling. The coin is above 66% of the daily stochastic. The daily stochastic is sloping horizontally as price consolidates.
Conclusion
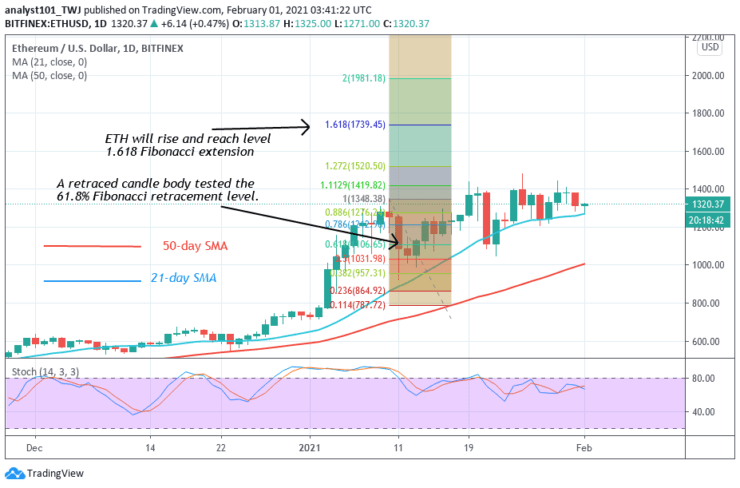
The Fibonacci tool analysis has remained the same as price consolidates. On January 10 uptrend; a retraced candle body tested the 61.8% Fibonacci retracement level. It indicates that the market will rise to level 1.618 Fibonacci extensions or the high of $1,1739.45
Note: Learn2.Trade is not a financial advisor. Do your research before investing your funds in any financial asset or presented product or event. We are not responsible for your investing
- Broker
- Min Deposit
- Score
- Visit Broker

- Award-winning Cryptocurrency trading platform
- $100 minimum deposit,
- FCA & Cysec regulated

- 20% welcome bonus of upto $10,000
- Minimum deposit $100
- Verify your account before the bonus is credited
- Fund Moneta Markets account with a minimum of $250
- Opt in using the form to claim your 50% deposit bonus
Learn to Trade
Never Miss A Trade Again

Signal Notification
Real-time signal notifications whenever a signal is opened, closes or Updated

Get Alerts
Immediate alerts to your email and mobile phone.

Entry Price Levels
Entry price level for every signal Just choose one of our Top Brokers in the list above to get all this free.