

DeFI Coin Price Forecast – Expert Analysis & Trading Tips | Learn 2 Trade – Expert Analysis & Trading Tips | Learn 2 Trade – Expert Analysis & Trading Tips | Learn 2 Trade – Expert Analysis & Trading Tips | Learn 2 Trade – August 17
The DeFI Coin price forecast is for the price to gather strength from consolidation to break the strong resistance at $0.14750.
DEFCUSD Long-Term Trend: Bullish (1-hour Chart)
Key Levels:
Supply Zones: $0.147500, $0.138900
Demand Zones: $0.113300, $0.122000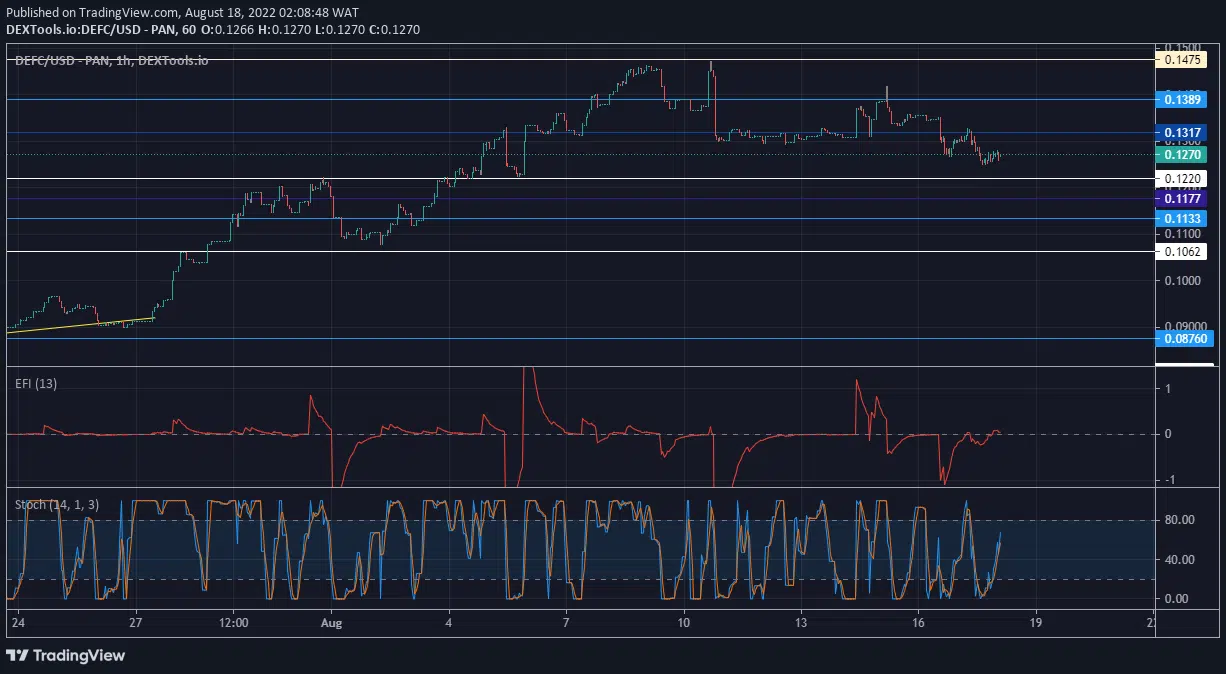
DeFI Coin Price Forecast – Expert Analysis & Trading Tips | Learn 2 Trade – Expert Analysis & Trading Tips | Learn 2 Trade – Expert Analysis & Trading Tips | Learn 2 Trade – Expert Analysis & Trading Tips | Learn 2 Trade: DEFCUSD Market Prospects
As the price rose from the $0.876000 support level, it encountered opposition. What the market simply did was to pull back to a strong key level and then spring off it to break that barrier.
However, the barrier at $0.147500 has proved to be almost insurmountable, rejecting the market strongly at early times. The price has therefore reverted to a ranging movement (which is a catalyst for a breakout).
Currently, the coin has bounced off from near the consolidation support level. The EFI (Elders Force Index) shows an equilibrium market as a progress from the bulls. The Stochastic lines are also rising from oversold.
DEFCUSD Medium-Term Trend: Bullish (15-Minute Chart)
The 15-minute chart shows the market is in a sideways trending movement. The price is set to rise upward after dropping to a low point. At some point, the coin is expected to gather enough impetus to challenge the $0.147500 resistance and break it.
You can purchase DeFi Coin here: Buy DEFC
Note: Learn2.trade is not a financial advisor. Do your research before investing your funds in any financial asset or presented product or event. We are not responsible for your investing results.


