

SILVER Weekly Price Analysis – August 18
When the bears gain more pressure, the support level of $19 may be broken downside, price may decrease and test the support levels of $18, and $17. In case the bulls defend the support level of $19, then, price may continue bullish trend towards $20 resistance level, it may incline to the resistance levels of $21 and $22.
XAGUSD Market
Key Levels:
Resistance levels: $20, $21, $22
Support levels: $19, $18, 417
XAGUSD Long-term trend: Bearish
XAGUSD is bearish on the long-term outlook. When the double bottom chart pattern formed on the daily time frame. The white metal increases and break up the resistance level of $19 which led to the testing of the $20 resistance level. The bulls tried to push the price towards the resistance level of $21 but the bears opposed the movement and the metal is currently pulling back towards $19 support level.
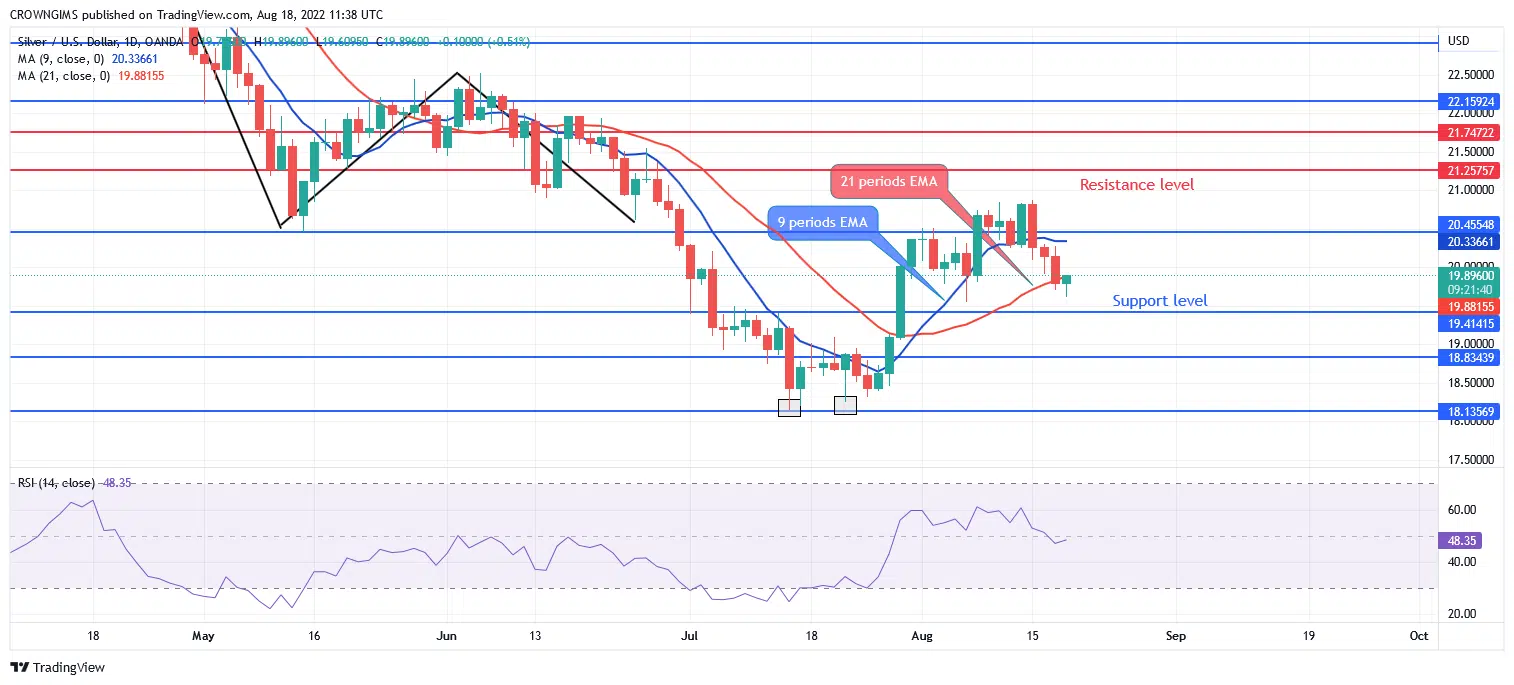
Bears are dominating the Silver market as it is trading below the 9 periods EMA and 21 periods EMA. When the bears gain more pressure, the support level of $19 may be broken downside, price may decrease and test the support levels of $18, and $17. In case the bulls defend the support level of $19, then, price may continue bullish trend towards $20 resistance level, it may incline to the resistance levels of $21 and $22.
XAGUSD Medium-term Trend: Bearish
XAGUSD is on the bearish movement on 4-hour chart. The formation of double bottom chart pattern triggers a bullish movement in the silver market last two weeks. The price increased and turned former resistance level of $19 to support level. The resistance level of $20 was tested and it pulled back and consolidates for few days. The price experienced a partial breakout towards $21 resistance level but sellers interrupted buyers. The price is currently decreasing towards the support level of $19.

Silver price is trading below the 9 periods EMA and 21 periods EMA. However, the Relative Strength Index period 14 is at 43 levels with the signal line displaying a bullish signal which may be a pullback.
You can purchase Lucky Block here. Buy LBLOCK


