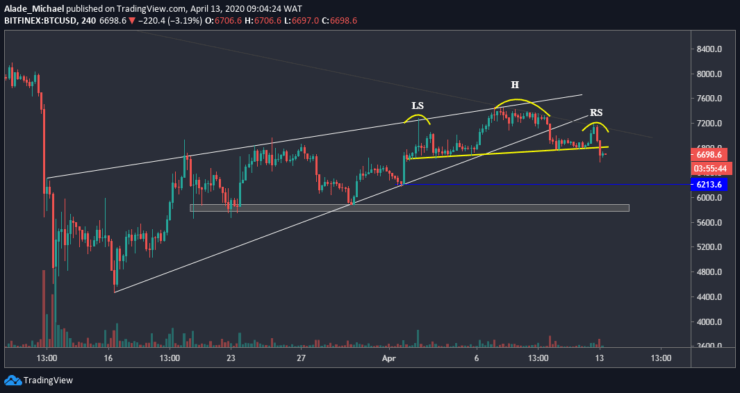
• After dropping off a month’s wedge, Bitcoin confirms reversal with a head-and-shoulders pattern on the 4-hours chart.
Starting the week with a 3% loss, Bitcoin’s price is now floating around $6700 against the US Dollar following a huge dump from $7191 over the last 24-hours. Due to this bearishness, the entire crypto market cap is now trading under $200 billion. Bitcoin would need to reclaim the $7450 (current high) to regain momentum.
Key resistance levels: $7000, $7191, $7450
Key support levels: $6400, $6200, $5880
Bitcoin (BTC) Price Analysis: 4H Chart – Bearish
Bitcoin started bearish after breaking a four-week rising wedge on April 11. Following this drops to $6800, Bitcoin consolidated for a while and made quick gains to $7191 (to retest the grey mid-term resistance line) yesterday; although Bitcoin dropped back and found new support around $6600 today.

Meanwhile, the latest drop below $6800 was a confirmation for a bearish reversal with a head-and-shoulders pattern, as shown on the price chart.
If Bitcoin losses the $6600 support, $6400 and $6200 (marked blue) would be the next selling targets for sellers. Below this support lie $6000 and $58800 – the grey horizontal area. From above, Bitcoin is holding resistance at $7191 and $7450. The bulls need to reclaim $7000 level to regain control.
Bitcoin (BTC) Price Analysis: Hourly Chart – Bearish
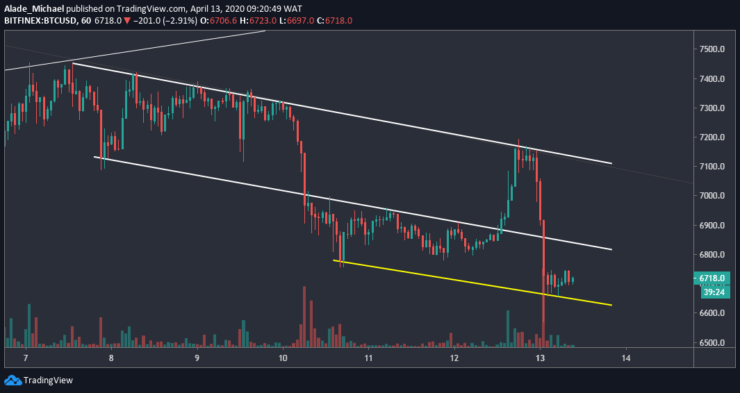
Looking at the bigger picture, Bitcoin saw significant volatility over the past 24-hours. We can see that the bears are back in the market after a quick retest to the upper boundary of the channel. As of now, Bitcoin is in the middle of consolidation following a recent break below the white descending channel.

Although the price is currently pinned at $6600. A climb above $6800 should provide buying to $7000-$7100 area, which is around the channel’s resistance. A break above this channel could activate short-term gains to $7450 and beyond. However, If Bitcoin’s price drops below the yellow line along with $6600, the next support area to keep in mind is $6500-$6400.
Note: Learn2Trade.com is not a financial advisor. Do your research before investing your funds in any financial asset or presented product or event. We are not responsible for your investing results
- Broker
- Min Deposit
- Score
- Visit Broker
- Award-winning Cryptocurrency trading platform
- $100 minimum deposit,
- FCA & Cysec regulated
- 20% welcome bonus of upto $10,000
- Minimum deposit $100
- Verify your account before the bonus is credited
- Fund Moneta Markets account with a minimum of $250
- Opt in using the form to claim your 50% deposit bonus
Learn to Trade
Never Miss A Trade Again

Signal Notification
Real-time signal notifications whenever a signal is opened, closes or Updated

Get Alerts
Immediate alerts to your email and mobile phone.

Entry Price Levels
Entry price level for every signal Just choose one of our Top Brokers in the list above to get all this free.


