Bitcoin (BTC) Price Analysis: Daily Chart – Neutral
Key resistance levels: $9500, $10000, $11350
Key support levels: $9000, $8820, $8500
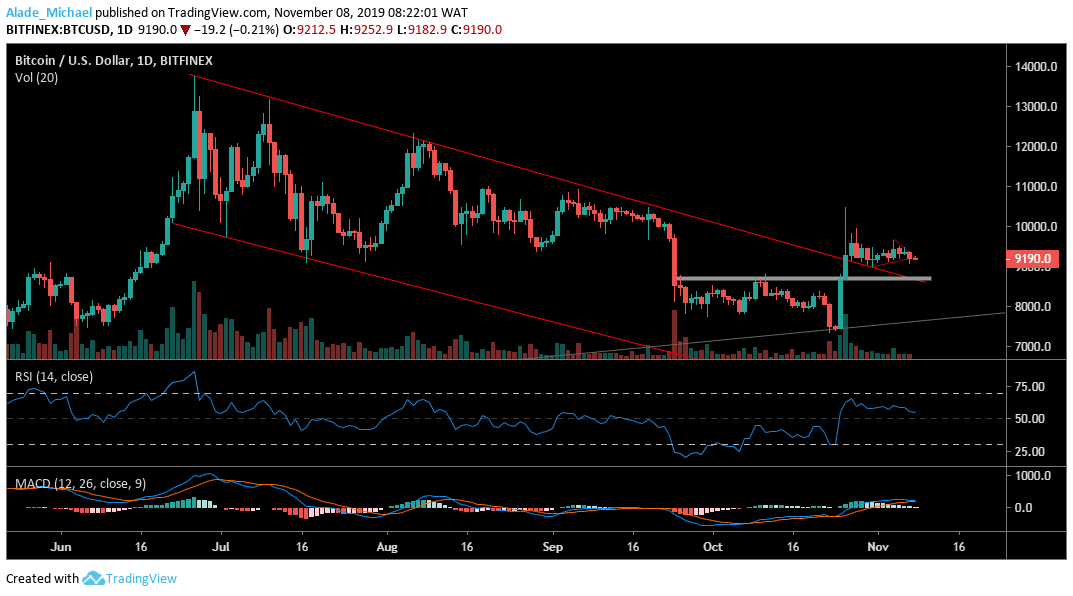
Bitcoin keeps sideways move and has remained calm for the past 12 days now. Since the October 26 rejection at around $11400, the price volatility has been subdued with a squeeze, although Bitcoin appears to be footing a bullish move. Before we can see a positive move, the market is likely to retest the $8500 – $8800 support zone. Meanwhile, Bitcoin currently held support at $9000.

If we can see an upward movement, the resistance to keep in mind is $9500, $10000 and $11350. The technical indicators suggest a potential downward shift in price which may play out if the MACD moving averages cross down. This may also bring the RSI to or below the 50 levels.
Bitcoin (BTC) Price Analysis: Hourly Chart – Bearish
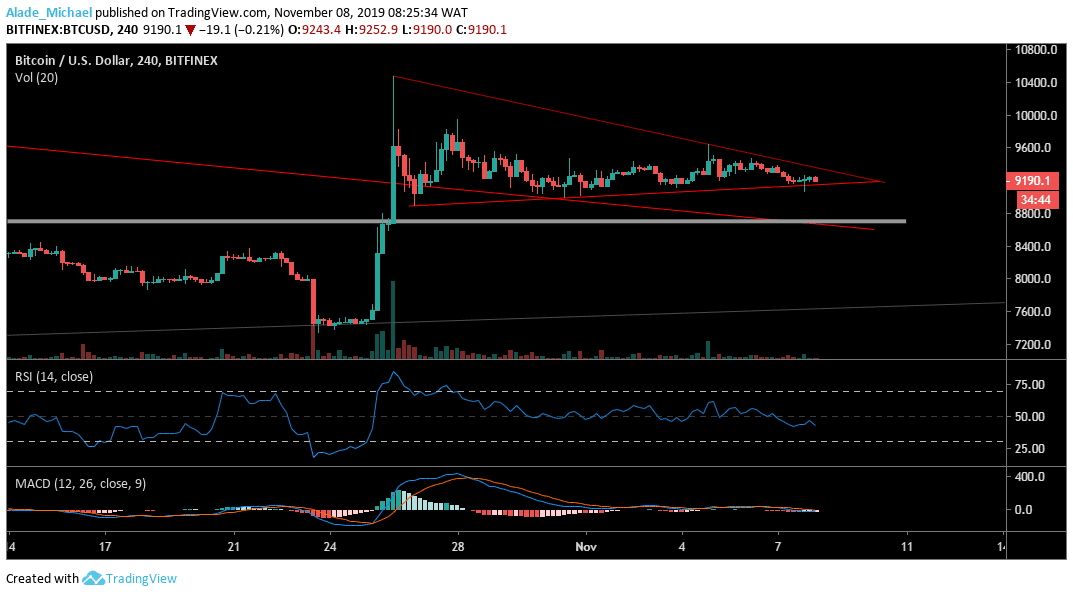
Bitcoin’s MACD has been floating at a fragile level for a while now. It appeared that we may see a price break-down if the technical indicator leaves the positive zone. Still, the BTC trading remains intact in the descending triangle formation – which could follow a bearish breakout. The $9000, $8880 and $8700 may possibly act as support.

Another thing to consider here is the RSI that shows bearish signs. Bitcoin may touch the above supports if the RSI continues to move downward. Alternatively, the bulls may regain control of the market if Bitcoin can break-up the triangle pattern to $9483 to $9776 but close resistance lies at $9300. With the bull flag formation, BTC remains indecisive on the 4-hour time frame.
BITCOIN SELL SIGNAL
Sell Entry: $9192
TP: $8833
SL: $9315
- Broker
- Min Deposit
- Score
- Visit Broker
- Award-winning Cryptocurrency trading platform
- $100 minimum deposit,
- FCA & Cysec regulated
- 20% welcome bonus of upto $10,000
- Minimum deposit $100
- Verify your account before the bonus is credited
- Fund Moneta Markets account with a minimum of $250
- Opt in using the form to claim your 50% deposit bonus
Learn to Trade
Never Miss A Trade Again

Signal Notification
Real-time signal notifications whenever a signal is opened, closes or Updated

Get Alerts
Immediate alerts to your email and mobile phone.

Entry Price Levels
Entry price level for every signal Just choose one of our Top Brokers in the list above to get all this free.


