

In the Australia 200 daily market, price action can be seen breaking the 9,000 ceiling over the past week. This appears to be the aftermath of rising concerns about U.S. regional banks and trade tensions weighing on market sentiment. Let’s examine how the market may perform in the coming week.
Key Price Levels
Resistance: 9,250, 9,500, 9,750
Support: 8,750, 8,500, 8,250
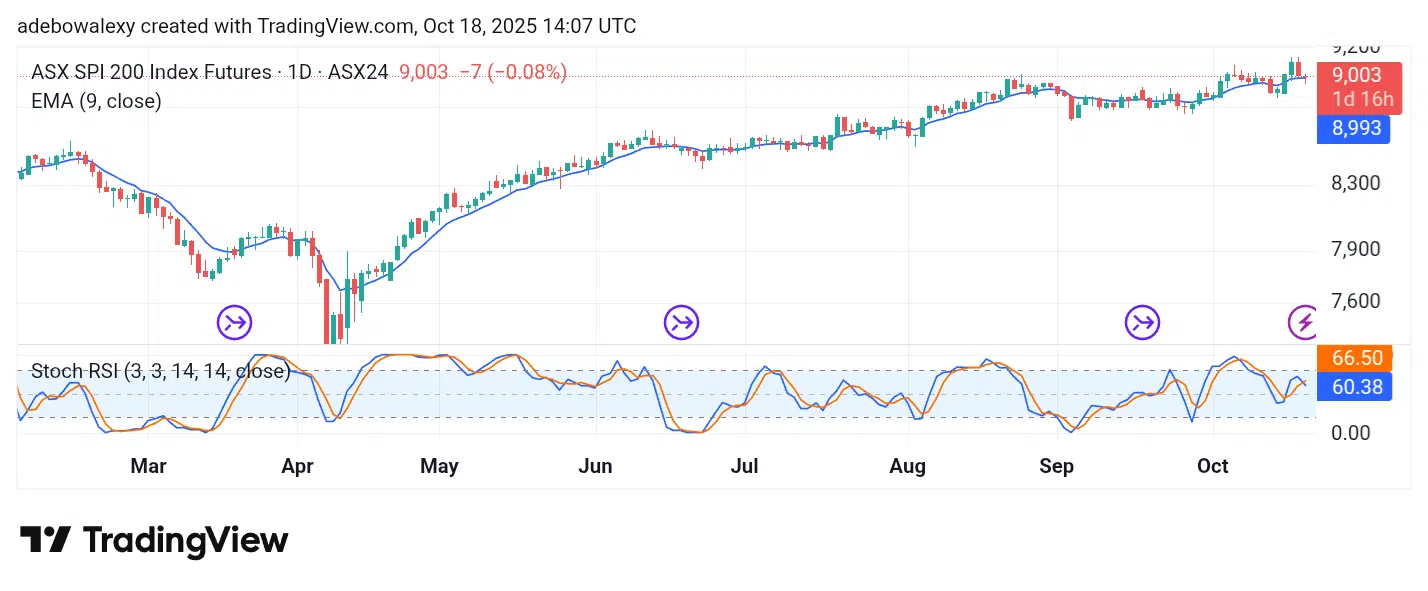
Australia 200 Hangs Above Key Levels
In the ASX 200 market, buyers broke through the psychological resistance at the 9,000 price level during the previous week. However, the market retraced downward toward the end of the week, closing in the red but still above the 9-day Exponential Moving Average (EMA) curve.
Meanwhile, the Stochastic Relative Strength Index (SRSI) indicator lines have just formed a downward crossover slightly below the 80 mark of the indicator. Technically, this hints at the possibility of the market slipping lower in the new week. Still, the fact that trading remains above the 9-day EMA provides some relief and support for bullish sentiment.

ASX 200 Upside Moves Look Suppressed
On the 4-hour Australia 200 chart, it is visible that price action has dipped below key technical levels. However, the closing session on Friday managed to end in the green. The corresponding price candle shows compression in the market, as the last candle has a longer upper shadow and stands below the 9-day EMA curve.
The SRSI indicator lines show a slight upward slope from below the 20 mark, indicating that price activity still has some upside potential above the 9,000 mark—provided favorable momentum emerges in the new week. Consequently, traders may still target the 9,100 price level in this market.
Make money without lifting your fingers: Start trading smarter today


