

The Australia 200 market has seen a notable dip following speculation surrounding the U.S. President’s announcement of imposing a 100% tariff on Chinese goods. This has caused futures to retreat below several key technical levels.
Key Price Levels
Resistance: 9,000, 9,250, 9,500
Support: 8,500, 8,000, 7,500
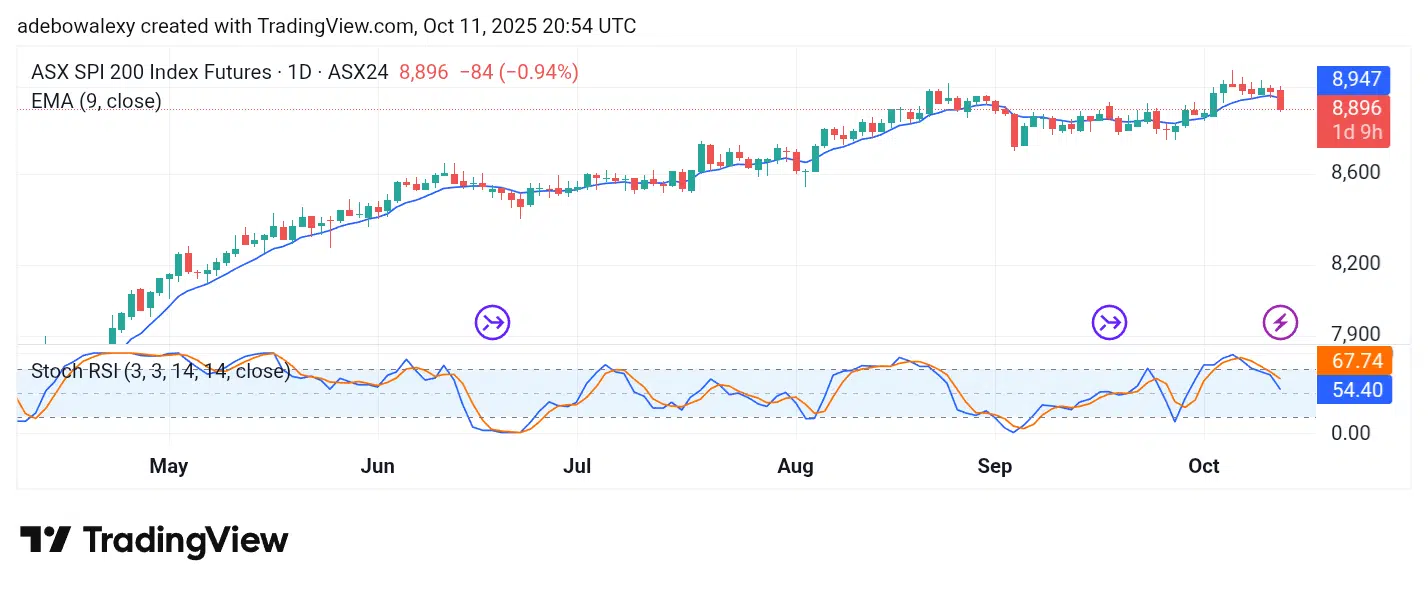
Australia 200 Sees a Strong Pullback
Price activity on the ASX 200 daily chart shows a sharp retreat below important technical levels. The most recent price candle appears quite conspicuous, bringing the market to trade below the 9-day Exponential Moving Average (EMA) line.
At the same time, the Stochastic Relative Strength Index (SRSI) indicator lines are turning smoothly downward from the overbought region toward the oversold zone. The lines of this indicator are still above the 50 mark, suggesting that the bears may have a strong base level.

ASX 200 Eyes Lower Support
In the Australia 200 market, price action has maintained a downward path for two consecutive sessions. The latest price candle has clearly appeared below the 9-day EMA line. The lines of the SRSI indicator have just delivered a downward crossover after rising slightly above the 9-day EMA curve.
The ensuing movement quickly took a clearer downward course. Considering current trading indications and the trajectory of price action, it appears that this market is heading toward the 8,750 price level.
Make money without lifting your fingers: Start trading smarter today


