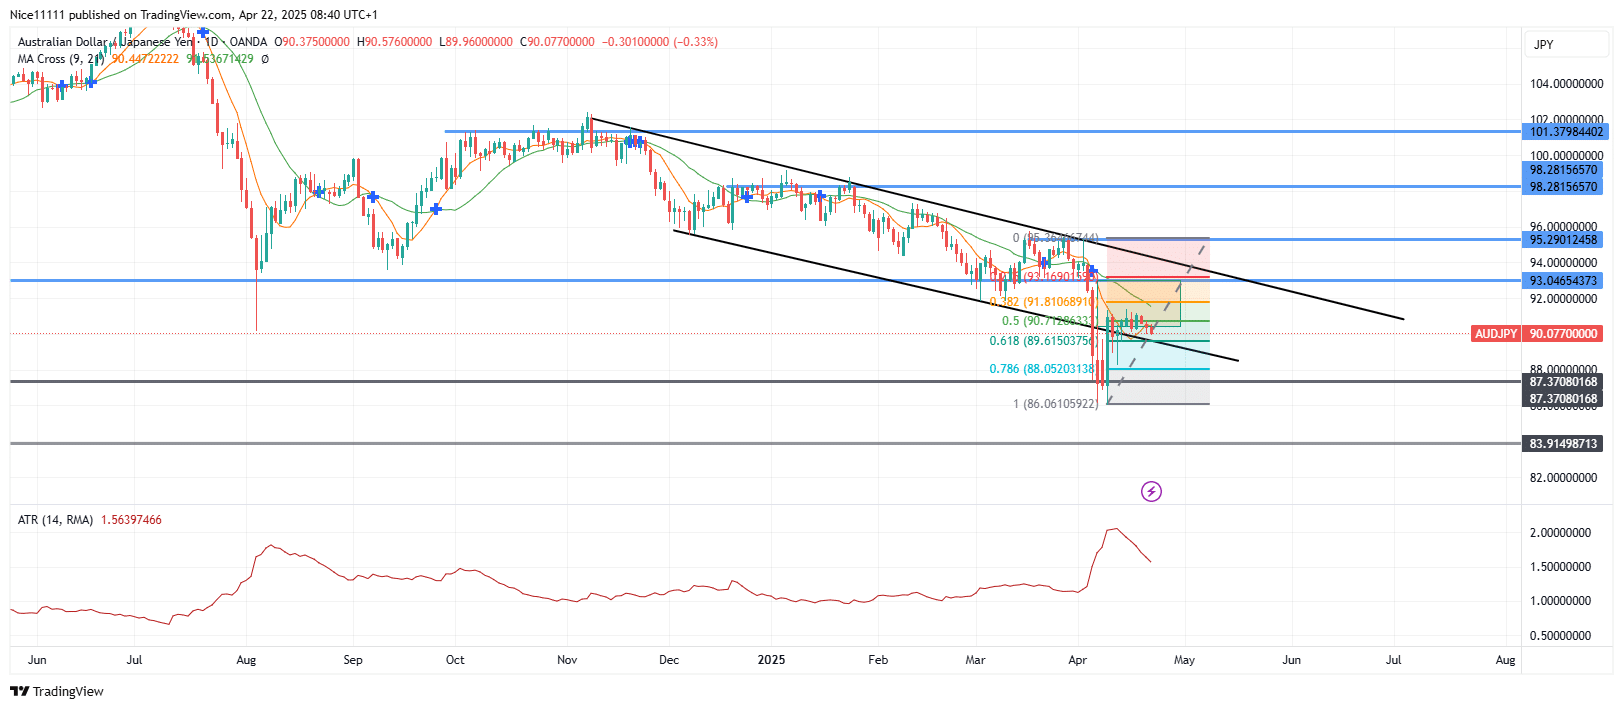
The AUDJPY currency pair has recently experienced a significant price breakout from a bearish channel in April, characterized by a swift and decisive movement. This breakout was swiftly followed by a rapid pullback, which retraced a portion of the prior move. As the pair reached the mid-range of the last prominent bearish displacement, a consolidation phase began, indicating a temporary balance between buying and selling pressures.
AUDJPY Key Levels
Demand Levels: 87.380 and 83.910
Supply Levels: 93.050 and 95.290
AUDJPY Long-term Trend: Bullish
On the daily chart, the major highs since November have formed a resistance trendline. This trendline has repelled price ascents on multiple occasions until March, when a bearish breakout occurred from a parallel channel. The breakout was marked by larger daily candles, causing a sudden rise in the Average True Range (ATR) due to increased daily volatility. This surge in ATR indicates heightened market activity and a potential shift in trend.
.
Following the breakout, the price initiated a quick pullback, which paused at the 50% Fibonacci retracement level. The price is currently stiffening, accompanied by a drastic decline in ATR in recent days. This decline in ATR suggests a decrease in market volatility, which often precedes a significant price move.
AUDJPY Short-term Trend: Bearish
On lower timeframes, the consolidation at the 50% Fibonacci level has formed a descending triangle pattern. This pattern typically indicates a bearish bias, and a breakout below the triangle’s support level is expected to continue the downward motion. Traders will likely be watching this level closely to generate accurate forex signals.
Trade on MT4 with Leverage up to 1:500! Trade on MT4 with Leverage up to 1:500!
X
We use cookies to ensure that we give you the best experience on our website. If you continue to use this site we will assume that you are happy with it.

 AUDJPY Short-term Trend: Bearish


