

ZKsync Price Forecast – February 11
The ZKSync price forecast indicates that buyers are making a recovery effort, rallying toward the $0.11580 key level after weeks of bearish pressure.
ZKsync Long-Term Trend: Bearish (Daily Chart)
Key Levels:
Support Levels: $0.09290, $0.08500
Resistance Levels: $0.11410, $0.15450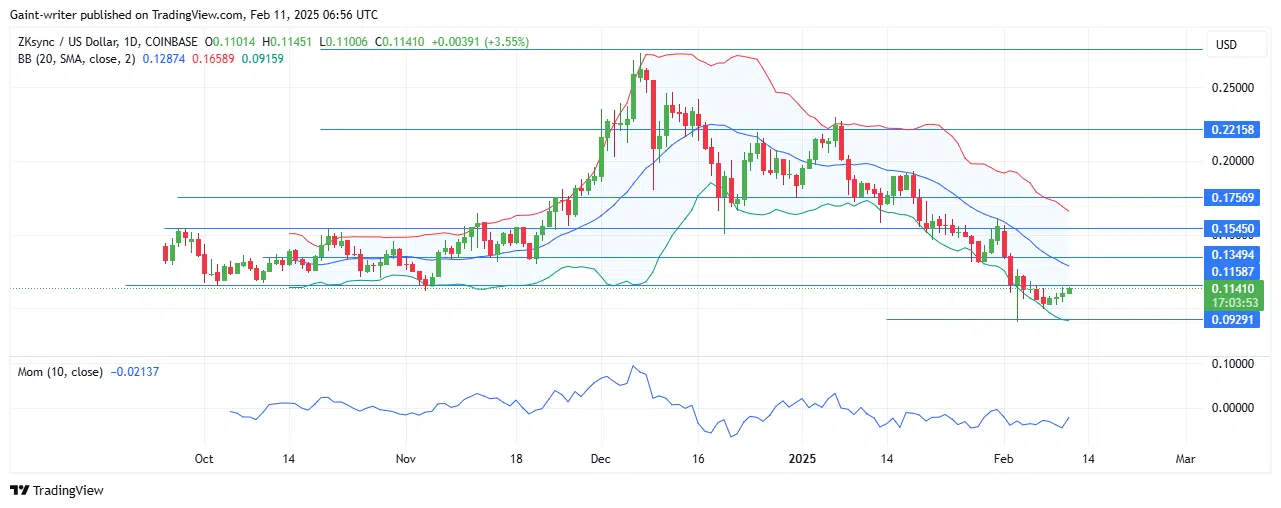
ZKsync Price Forecast – ZKUSD Outlook
For buyers to regain control, they must sustain momentum and break through key resistance zones. , with bulls struggling to hold their ground. A failed breakout attempt at $0.15450 in early February led to a deeper bearish continuation, driving prices down to the $0.09290 market level before the current rebound.
The Bollinger Bands indicate increased market volume, suggesting a major price movement could be imminent. Although the Momentum indicator remains weak, it is beginning to show signs of recovery, signaling that buyers are attempting to reassert control.
A move above $0.11410 could trigger further upside movement toward the $0.15450 key level. However, if buyers fail to sustain their current position, a retest of $0.09290 or lower remains likely. A breakout above the mid-level of the Bollinger Bands would confirm a bullish shift.
ZKsync Medium-Term Trend: Bullish (4-Hour Chart)
On lower timeframes, ZKUSD is displaying early signs of buyer confidence, though sellers still hold the upper hand. Momentum is beginning to build, but buyers require additional strength to drive the price higher.
Make money without lifting your fingers: Start using a world-class auto trading solution
How To Buy Lucky Block
Note: Learn2.trade is not a financial advisor. Do your research before investing your funds in any financial asset, product, or event. We are not responsible for your investment results.


