

Quant Price Forecast: February 11
The Quant price forecast suggests a potential bullish breakout as the coin continues testing the $91.80 resistance level. A successful breakout could bring the market back into a previous consolidation zone.
Quant Long-Term Trend: Bearish (1-Day Chart)
Key Levels:
Supply Levels: $91.80, $101.65
Demand Levels: $56.15, $73.00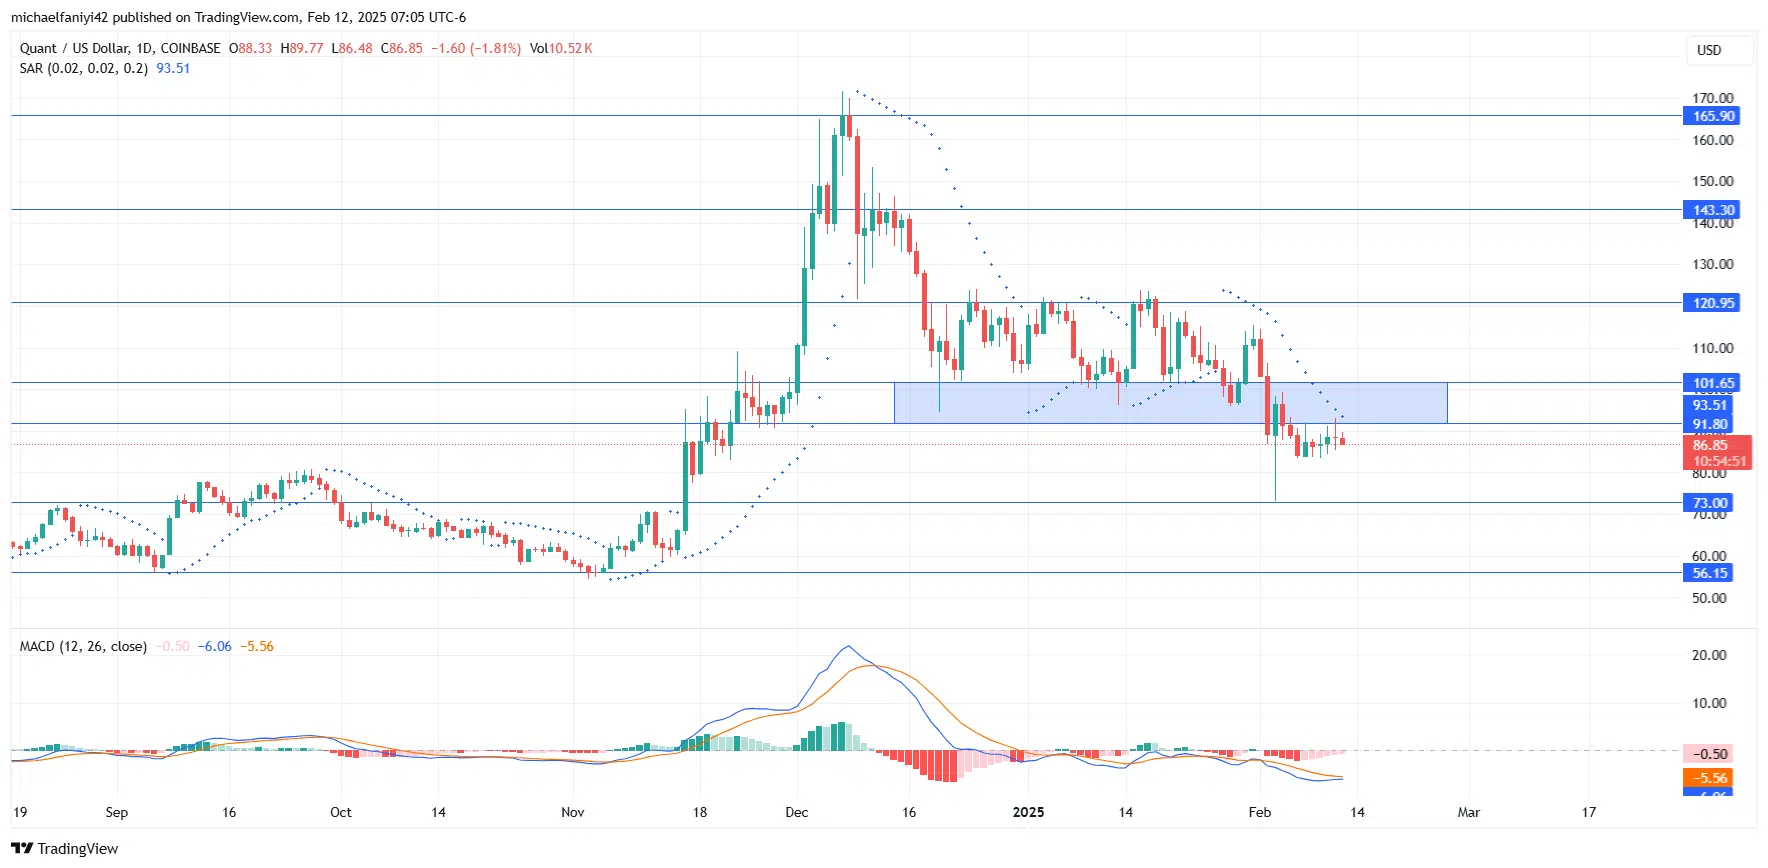
Quant Price Forecast: QNTUSD Outlook
QNTUSD Medium-Term Trend: Bullish (4-Hour Chart)
The 4-hour chart provides a clearer view of how the candles repeatedly test the $91.80 former demand zone. As a result, the Parabolic SAR dots are now alternating around the candles as price action fluctuates below the zone.
Make money without lifting your fingers: Start using a world-class auto trading solution
How To Buy Lucky Block
Note: Learn2.trade is not a financial advisor. Do your research before investing your funds in any financial asset, product, or event. We are not responsible for your investment results.


