Don’t invest unless you’re prepared to lose all the money you invest. This is a high-risk investment and you are unlikely to be protected if something goes wrong. Take 2 minutes to learn more
ZKsync Market Analysis- February 9
ZKsync continues to drift lower as sellers retain structural advantage. The ZKsync market remains entrenched in a downward cycle, with technical indicators broadly reinforcing the dominance of supply over demand. Price action is positioned beneath declining short- and medium-term moving averages, highlighting an environment where rebounds lack sustainability and upside momentum remains limited. The overall indicator configuration is negatively skewed, as momentum tools such as the MACD remain unable to recover positive territory, signaling weak buyer participation and a lack of meaningful accumulation.
ZKsync Key Levels
Resistance Levels: $0.0560, $0.0880
Support Levels: $0.0200, $0.0100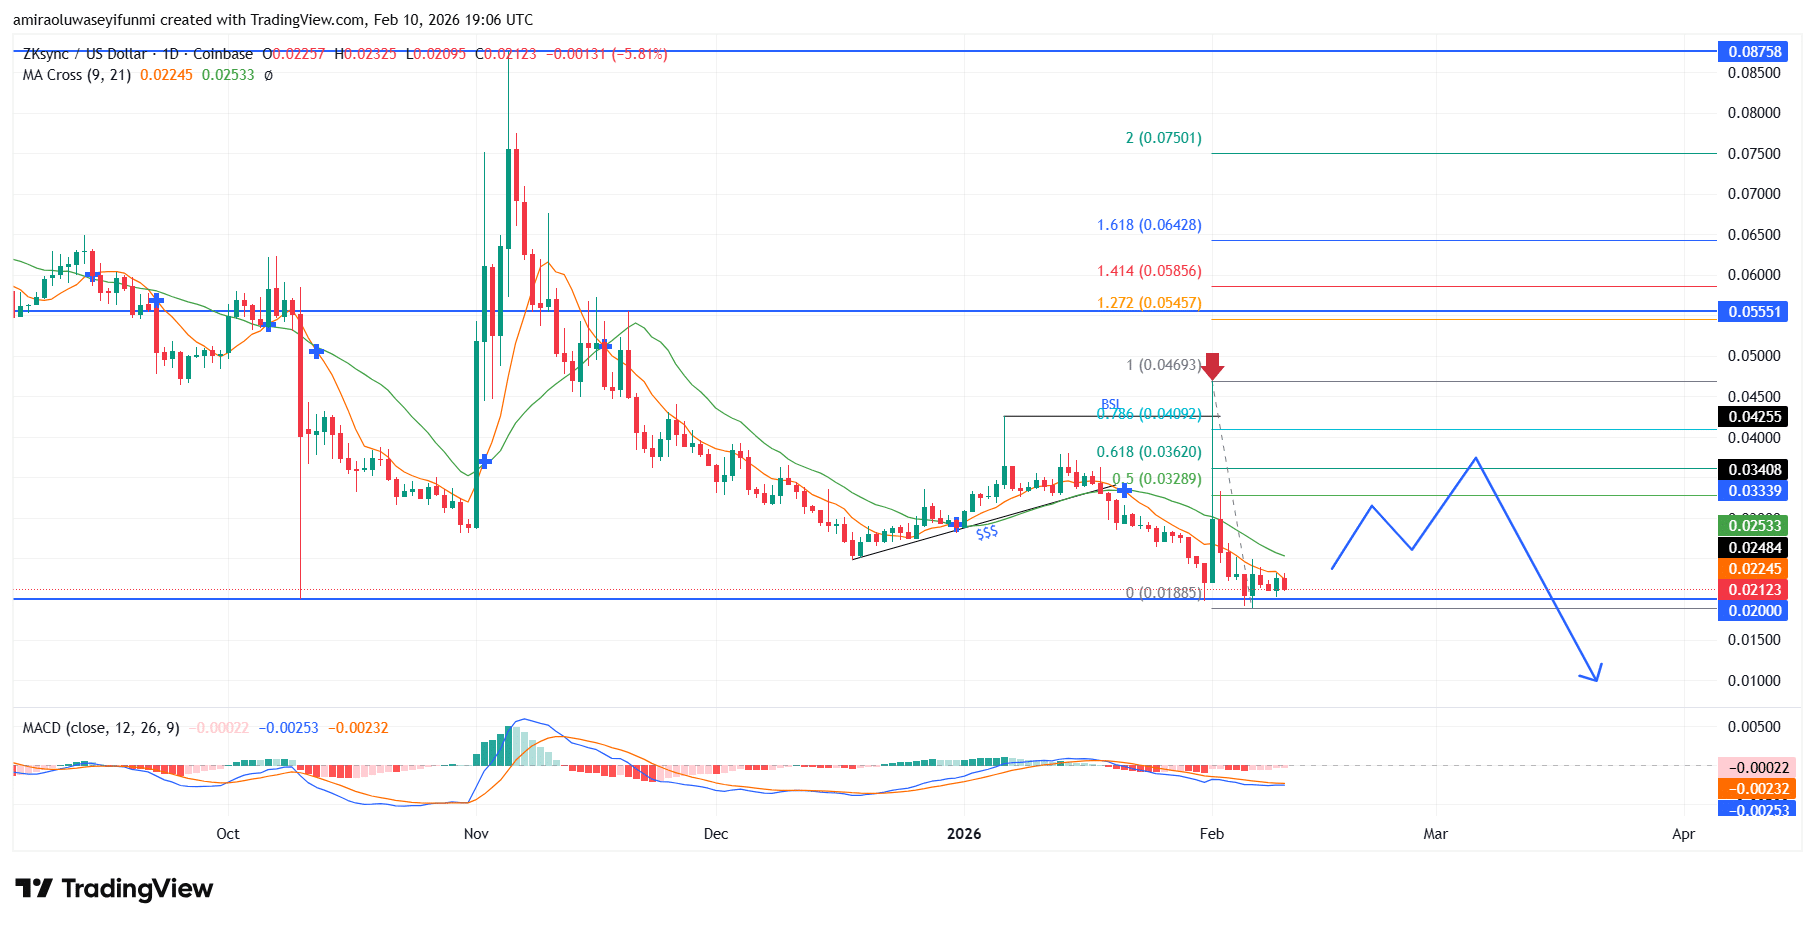
ZKsync Long-Term Trend: Bearish
From a structural standpoint, the chart continues to produce a sequence of lower highs and lower lows, keeping the bearish framework firmly intact. Attempts to reclaim territory above $0.0330 have been decisively rejected, while reactions around $0.0250 have repeatedly failed, confirming these zones as active distribution areas. The recent decline into the $0.0210–$0.0200 range highlights growing acceptance of lower price levels, as historical demand pockets have provided minimal defense against sustained selling pressure.
Looking ahead, as long as price remains capped below the $0.0250 threshold, downside risk remains the prevailing technical theme. A decisive break and sustained trading below $0.0200 would likely expose $0.0190, with potential for further erosion toward the $0.0150 psychological region. Any countertrend rebound toward $0.0330 or even $0.0420 should be interpreted as a relief rally within a broader downtrend rather than confirmation of structural reversal.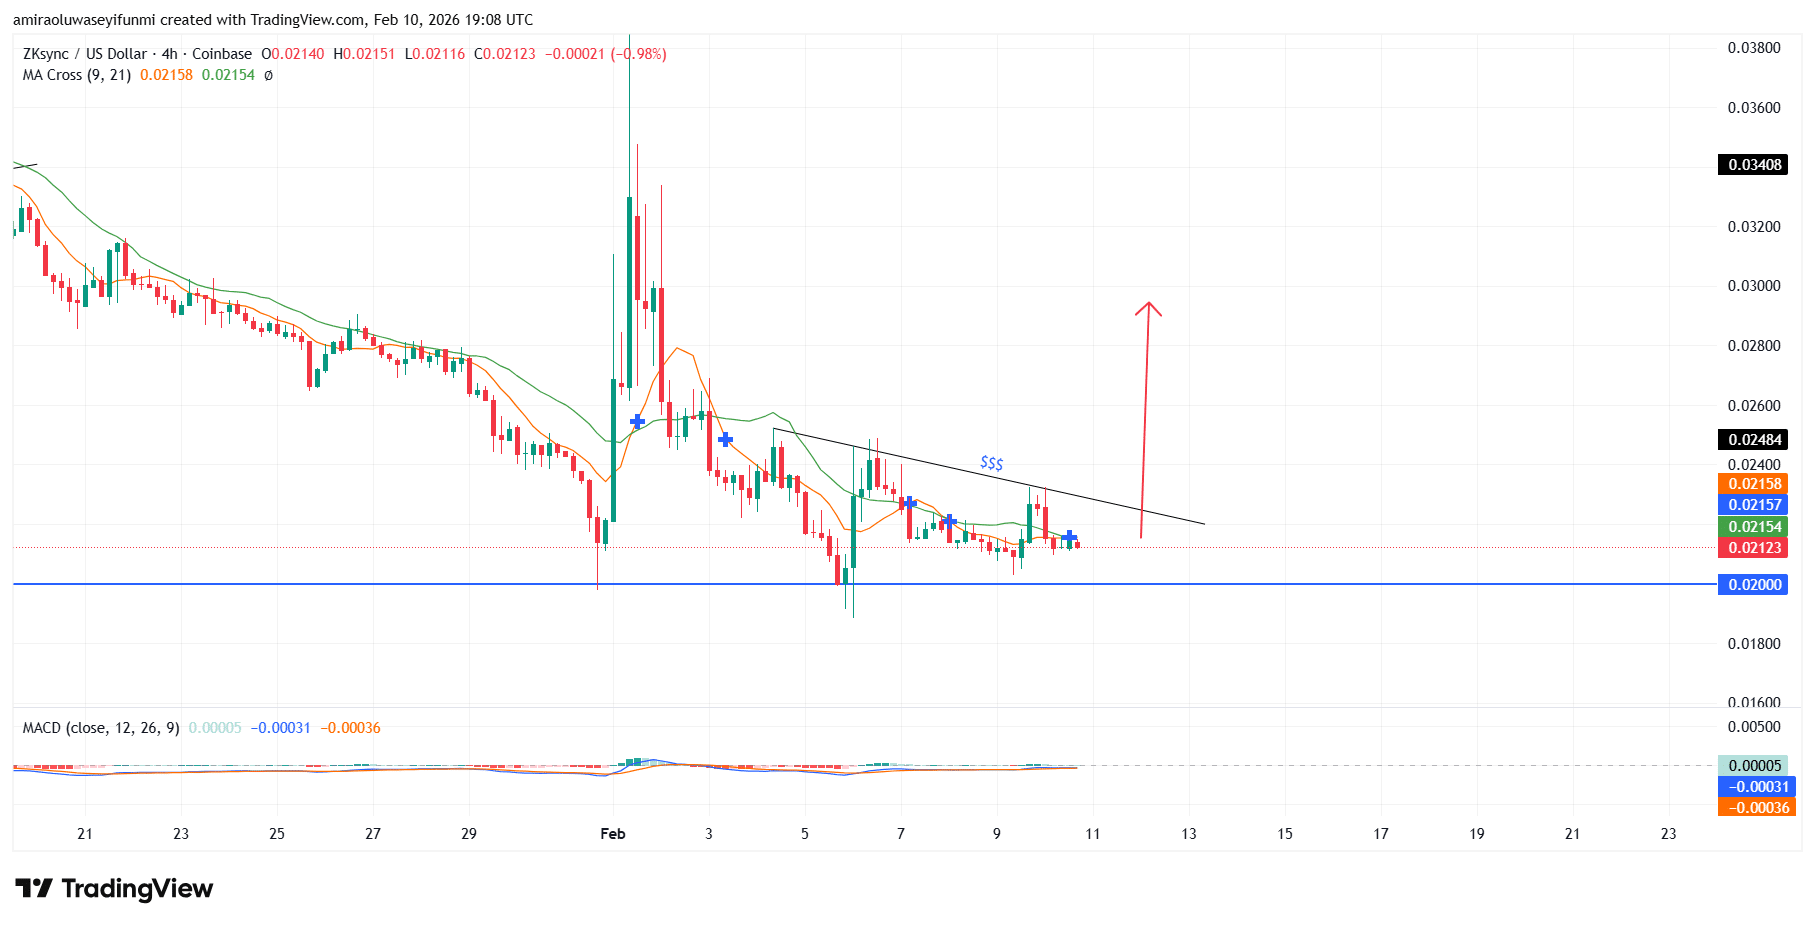
ZKsync Medium-Term Trend: Bullish
ZKsync on the four-hour chart is showing early indications of a short-term bullish shift, with price stabilizing above the $0.0200 support level and downside momentum beginning to fade. The market is compressing beneath a descending trendline around $0.0230–$0.0240, suggesting the potential for volatility expansion once this structure resolves.
Momentum indicators are flattening near neutral territory, signaling that selling pressure is easing rather than intensifying. A confirmed breakout above $0.0245 could pave the way for upside continuation toward $0.0280 and $0.0300, a development that short-term crypto signals participants may monitor closely.
Make money without lifting your fingers: Start using a world-class auto trading solution
How To Buy Lucky Block
Note: Learn2.trade is not a financial advisor. Do your research before investing your funds in any financial asset, product, or event. We are not responsible for your investment results.
- Broker
- Min Deposit
- Score
- Visit Broker

- Award-winning Cryptocurrency trading platform
- $100 minimum deposit,
- FCA & Cysec regulated

- 20% welcome bonus of upto $10,000
- Minimum deposit $100
- Verify your account before the bonus is credited
- Fund Moneta Markets account with a minimum of $250
- Opt in using the form to claim your 50% deposit bonus
Learn to Trade
Never Miss A Trade Again

Signal Notification
Real-time signal notifications whenever a signal is opened, closes or Updated

Get Alerts
Immediate alerts to your email and mobile phone.

Entry Price Levels
Entry price level for every signal Just choose one of our Top Brokers in the list above to get all this free.