XRP/USD Market February 02
A further increase in the bears’ pressure may push the price to penetrate the support level of $0.28 level; this may decrease the price to $0.39 and $0.28. In case the support level of $0.28 does not give way, the price may increase to the previous high levels of $0.62, $0.73, and $0.79. The relative strength index period 14 is at 50 levels with the signal line pointing downside to indicate the selling market.
Key Levels:
Resistance levels: $0.62, $0.73, $0.79
Support levels: $0.49, $0.39, $0.28
XRP/USD Long-term Trend: Bearish
XRPUSD is bearish on the daily chart. The market is highly volatile yesterday as bulls initially overpowered the bears and that is why the price is soaring higher. The bulls’ pressure broke up $0.39, $0.49 and $0.62 price level and the resistance level of $0.73 is tested. The bears oppose the price increase. The price is pushed down with the formation of long legged daily candle; the price is targeting the previous low.
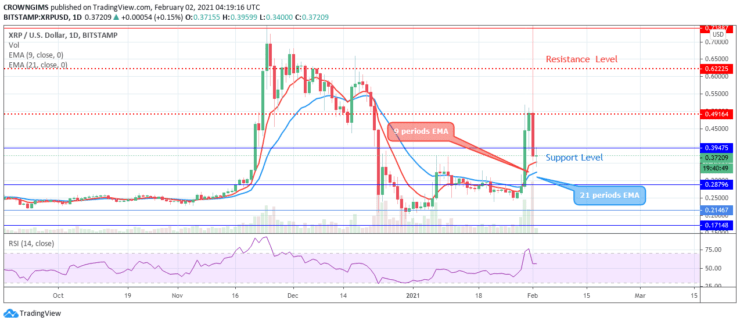
The two EMAs are well separated and the price is trading above the 9 periods EMA and 21 periods EMA at a close range as a symbol of a bullish market. A further increase in the bears’ pressure may push the price to penetrate the support level of $0.28 level; this may decrease the price to $0.39 and $0.28. In case the support level of $0.28 does not give way, the price may increase to the previous high levels of $0.62, $0.73, and $0.79. The relative strength index period 14 is at 50 levels with the signal line pointing downside to indicate the selling market.
XRP/USD Medium-term Trend: Bearish
XRPUSD is bearish on the medium-term outlook. The bulls’ momentum was higher than that of the bulls’ in the 4-hours chart at the beginning of the trading yesterday; the price is greatly increasing towards the resistance level of $0.73. The bears reacted sharply against the increase and there is a formation of inverted pin bar. It is a bearish candle pattern and this triggers the falling of the price to previous low at $0.28 level.
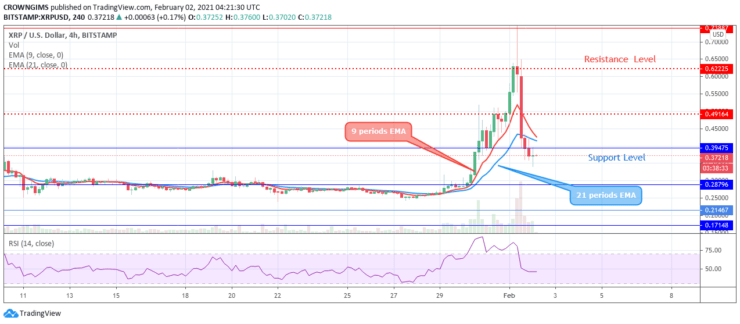
The two EMAs are above the price currently and the price is trading below the 9 periods EMA and 21 periods EMA. The relative strength index period 14 is pointing down at 50 level to indicate a sell signal.
- Broker
- Min Deposit
- Score
- Visit Broker

- Award-winning Cryptocurrency trading platform
- $100 minimum deposit,
- FCA & Cysec regulated

- 20% welcome bonus of upto $10,000
- Minimum deposit $100
- Verify your account before the bonus is credited
- Fund Moneta Markets account with a minimum of $250
- Opt in using the form to claim your 50% deposit bonus
Learn to Trade
Never Miss A Trade Again

Signal Notification
Real-time signal notifications whenever a signal is opened, closes or Updated

Get Alerts
Immediate alerts to your email and mobile phone.

Entry Price Levels
Entry price level for every signal Just choose one of our Top Brokers in the list above to get all this free.