NEO Price Analysis – February 02
Should the bulls push up the price above the resistance level of $25, then, the price may increase to $28 and $32 price level. In case the bears prevail and the price burst out at the support level of $22, the price will reduce to the $19 support level and may test the $15 level.
NEO/USD Market
Key Levels:
Resistance levels: $25, $28, $32
Support levels: $22, $19, $15
NEO/USD Long-term Trend – Ranging
NEOUSD is on the ranging mode in the daily chart. The short “M” pattern formed last two weeks drove the price down to the support level of $19 on January 27. The mentioned level holds the price and it could not break it down. The bulls tried and pick up the market but the momentum is not strong enough to drive the market fast. The price consolidates between the two dynamic support and resistance level throughout last week. Today, it seems the bulls want to dominate the market as the bullish candle open the market.
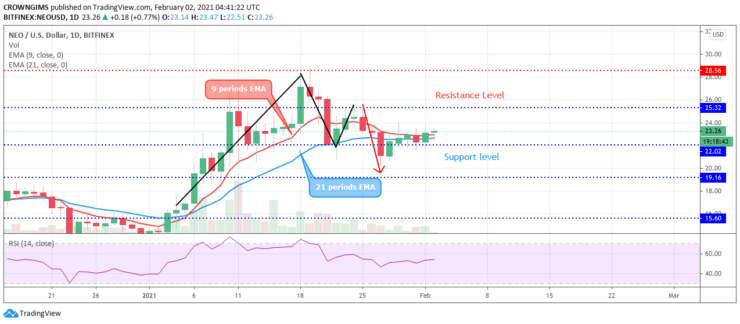
The two EMAs are parallel to each other at a close range and the coin is trading in between the 9 periods EMA and 21 periods EMA. Should the bulls push up the price above the resistance level of $25, then, the price may increase to $28 and $32 price level. In case the bears prevail and the price burst out at the support level of $22, the price will reduce to the $19 support level and may test the $15 level. However, the relative strength index period 14 is displaying a bullish signal.
NEO/USD Medium-term Trend – Ranging
The bulls’ momentum and the bears’ momentum are at equilibrium in the 4-hour chart. The support level of $19 was tested on January 27, the price bounces off the level and inclined towards the resistance level of $25. The bearish momentum became weak and the price could not reach the mark. The price results in consolidation around $22 price level.
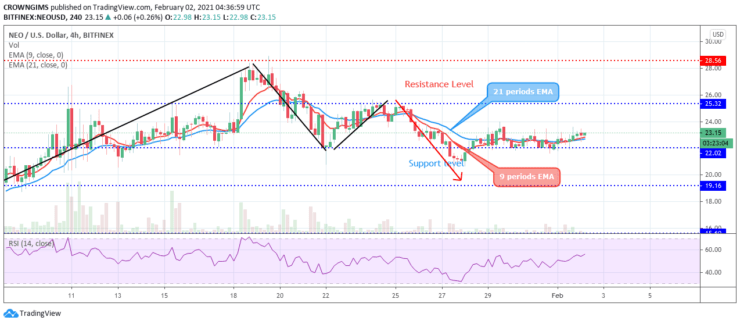
The 9 periods EMA is interlocking to the 21 periods EMA while the price is trading over and around the two EMAs. The relative strength index period 14 is displaying a bullish signal.
- Broker
- Min Deposit
- Score
- Visit Broker

- Award-winning Cryptocurrency trading platform
- $100 minimum deposit,
- FCA & Cysec regulated

- 20% welcome bonus of upto $10,000
- Minimum deposit $100
- Verify your account before the bonus is credited
- Fund Moneta Markets account with a minimum of $250
- Opt in using the form to claim your 50% deposit bonus
Learn to Trade
Never Miss A Trade Again

Signal Notification
Real-time signal notifications whenever a signal is opened, closes or Updated

Get Alerts
Immediate alerts to your email and mobile phone.

Entry Price Levels
Entry price level for every signal Just choose one of our Top Brokers in the list above to get all this free.