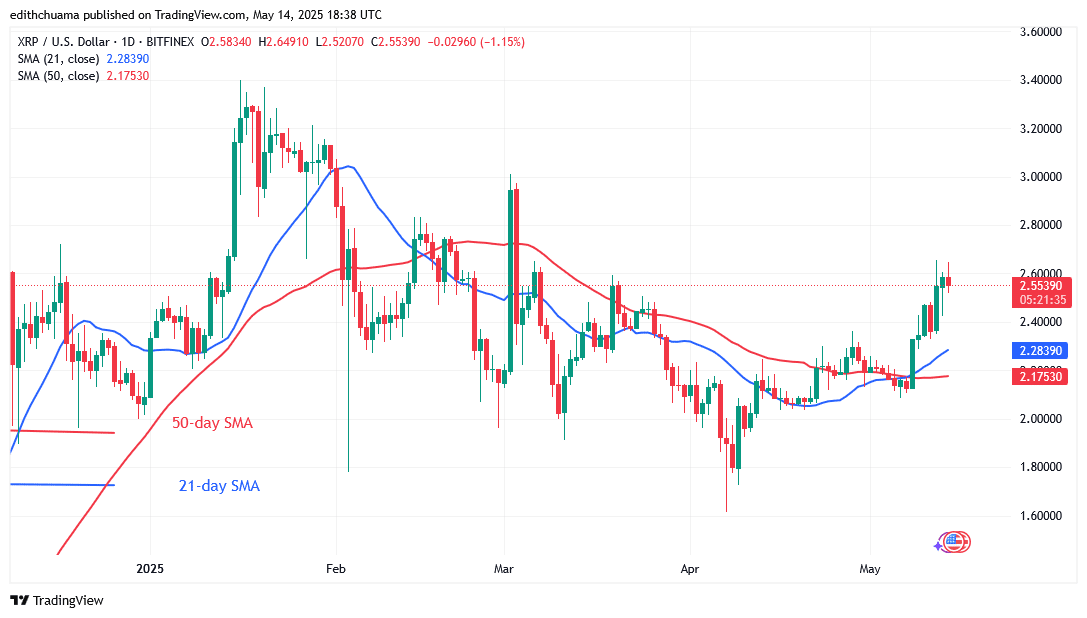
XRP/USD Long-term Trend: Bullish
The price of XRP recovers positive momentum but returns to its range below $2.65. The cryptocurrency price broke above the moving average lines and the $2.36 barrier. XRP price rose to $2.65 but fell back below it. For the past 48 hours, XRP has fluctuated below its recent high. If the $2.60 barrier is broken, the crypto asset will reach a high of $3.00.
However, if the altcoin falls below the $2.60 barrier, XRP will return to its prior range. In other words, the altcoin will trade above the moving average lines but below the resistance of $2.60. On the other hand, the altcoin will trade above the $2.00 support and below the $2.60 level where the bears break below the moving average lines. XRP is now worth $2.56.
Technical indicators
Key Resistance Levels: $2.50, $3.00, $3.50
Key Support Levels: $1.50, $1.00, $0.50
Daily Chart Indicators Reading:
The moving average lines show the 21-day SMA above the 50-day SMA. The moving average lines represent a bullish signal. There are long candlestick wicks pointing to the recent peak. The altcoin is facing severe selling pressure at its recent high.
XRP/USD Medium-term Trend: Bullish
The altcoin has gained significantly on the upside. The cryptocurrency is in an uptrend with higher highs and higher lows. The price bars have risen and are now stuck at their most recent high. XRP trades above the 21-day SMA support but below the resistance at $2.65.
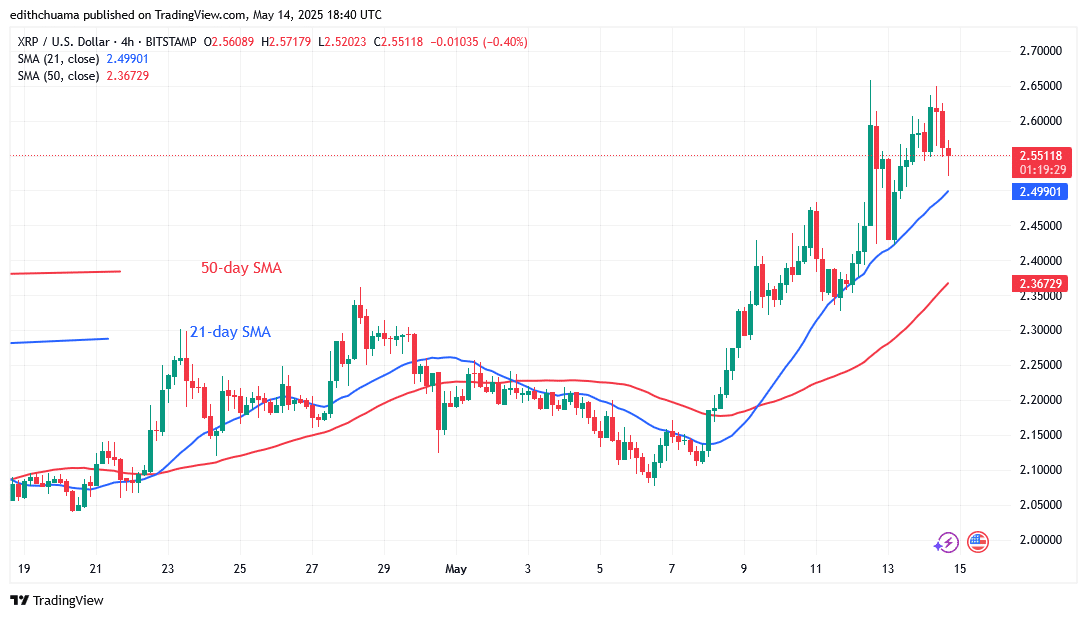
4-hour Chart Indicators Reading
The 21- and 50-day SMAs are sloping northward, indicating an uptrend. The price bars have stalled above the 21-day SMA support, indicating a possible continued upward advance. XRP will continue selling pressure if the 21-day SMA support is violated. The candlestick wicks point to the $2.65 high, signaling strong selling pressure.
General Outlook for Ripple (XRP)
The XRP price breaks above the moving average lines but returns to its range below $2.65. XRP is trading below the $2.60 barrier and above the moving average lines. When range-bound levels are breached, the cryptocurrency will trend. On the 4-hour chart, the price bars are above the 21-day SMA support. The current upsurge will end if the price breaks below the 21-day SMA support.
Make money without lifting your fingers: Start using a world-class auto trading solution.
Note: Learn2.Trade is not a financial advisor. Do your research before investing your funds in any financial asset, product, or event. We are not responsible for your investment results.
- Broker
- Min Deposit
- Score
- Visit Broker

- Award-winning Cryptocurrency trading platform
- $100 minimum deposit,
- FCA & Cysec regulated

- 20% welcome bonus of upto $10,000
- Minimum deposit $100
- Verify your account before the bonus is credited
- Fund Moneta Markets account with a minimum of $250
- Opt in using the form to claim your 50% deposit bonus
Learn to Trade
Never Miss A Trade Again

Signal Notification
Real-time signal notifications whenever a signal is opened, closes or Updated

Get Alerts
Immediate alerts to your email and mobile phone.

Entry Price Levels
Entry price level for every signal Just choose one of our Top Brokers in the list above to get all this free.