XRP/USD Long-term Trend: Bearish
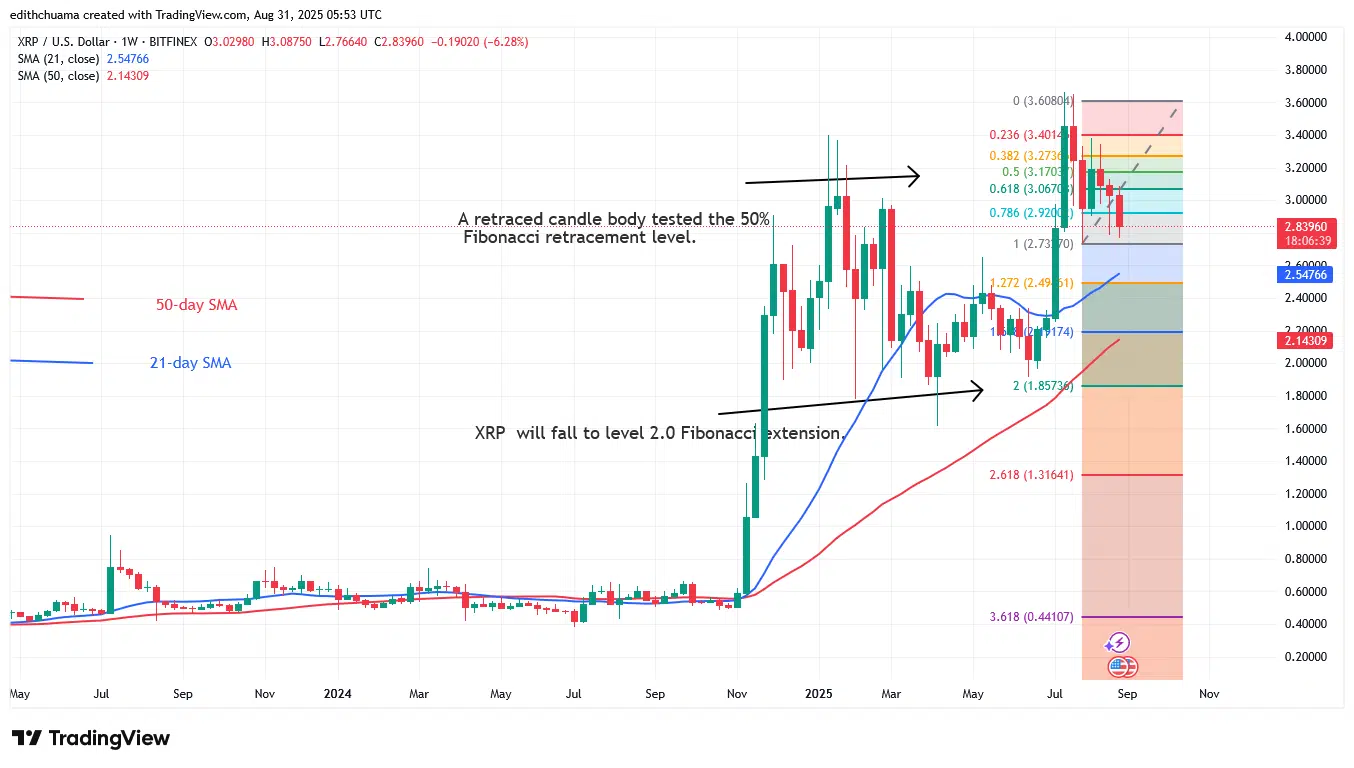
XRP’s price has progressively fallen below $2.75 level after reaching resistance at $3.64. The price was driven up by buyers after it had dropped. The upward corrective was short-lived, as XRP was rebuffed at its $3.38 high. This second rejection indicates that XRP will continue to fall to the downside. The altcoin is below the moving average lines on a time period, which signifies a decrease in the cryptocurrency.
The price indication has suggested a possible decline to the $1.85 low, or the 2.0 Fibonacci extension. However, XRP has dipped, although it remains above the $2.70 support level. If the current price is breached, the cryptocurrency will decrease. The current value of XRP is $2.83.
Technical indicators
Key Resistance Levels: $2.50, $3.00, $3.50
Key Support Levels: $1.50, $1.00, $0.50
Weekly Chart Indicators Reading:
The price bars are heading downward, towards the moving average lines. If the price falls below the 21-day SMA, selling pressure will continue. The long candlestick wicks are pointing across $3.60, indicating strong selling pressure at the recent peak. Furthermore, long candlestick tails are heading across the $3.00 support, indicating strong buying demand at the current support.
XRP/USD Medium-term Trend: Bearish
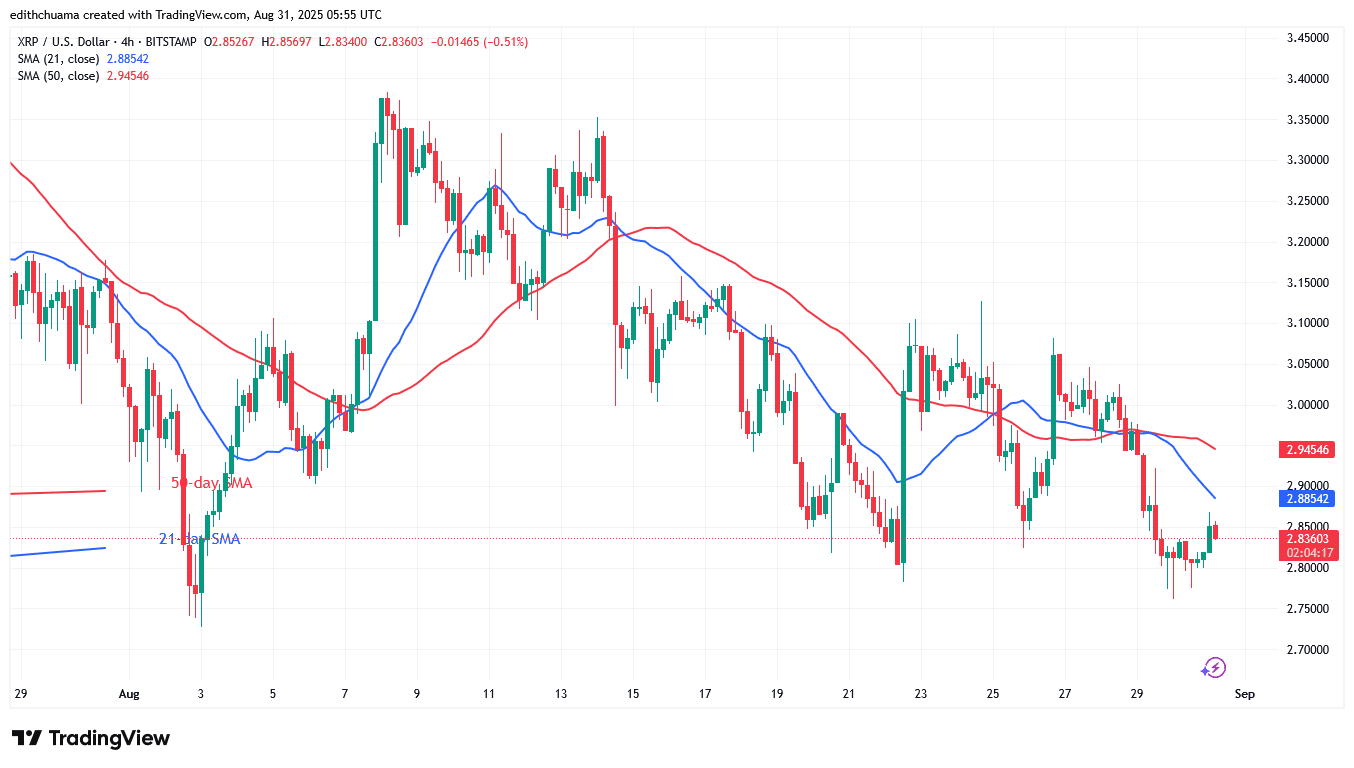
Since August 22, XRP has fallen below the moving average lines and reached a low of $2.78. For the past week, XRP has traded above the $2.75 support level and below the $3.10 resistance level or the moving averages. Bears have pushed the price down to a lower range. There will be more selling pressure if the bottom price range is broken.
4- Chart Indicators Reading
The moving average lines are sloping lower, signaling the downtrend. There is a positive indication when the 21-day SMA is below the 50-day SMA. The price bars are moving steadily as the Doji candlesticks appear, causing the altcoin to resume a range-bound move. The moving average lines are sloping lower, signaling the downtrend. The price bars are moving steadily as the Doji candlesticks appear, causing the altcoin to resume a range-bound move.
General Outlook for Ripple (XRP)
The price of XRP steadily declines below the $2.75 level as per the price prediction. Bulls are defending the lower price range of $2.75, while bears retest the existing support. The crypto signal is bearish, as the altcoin falls below the moving average lines.
Make money without lifting your fingers: Start using a world-class auto trading solution.
Note: Learn2.Trade is not a financial advisor. Do your research before investing your funds in any financial asset, product, or event. We are not responsible for your investment results.
- Broker
- Min Deposit
- Score
- Visit Broker

- Award-winning Cryptocurrency trading platform
- $100 minimum deposit,
- FCA & Cysec regulated

- 20% welcome bonus of upto $10,000
- Minimum deposit $100
- Verify your account before the bonus is credited
- Fund Moneta Markets account with a minimum of $250
- Opt in using the form to claim your 50% deposit bonus
Learn to Trade
Never Miss A Trade Again

Signal Notification
Real-time signal notifications whenever a signal is opened, closes or Updated

Get Alerts
Immediate alerts to your email and mobile phone.

Entry Price Levels
Entry price level for every signal Just choose one of our Top Brokers in the list above to get all this free.