XRP/USD Long-term Trend: Ranging
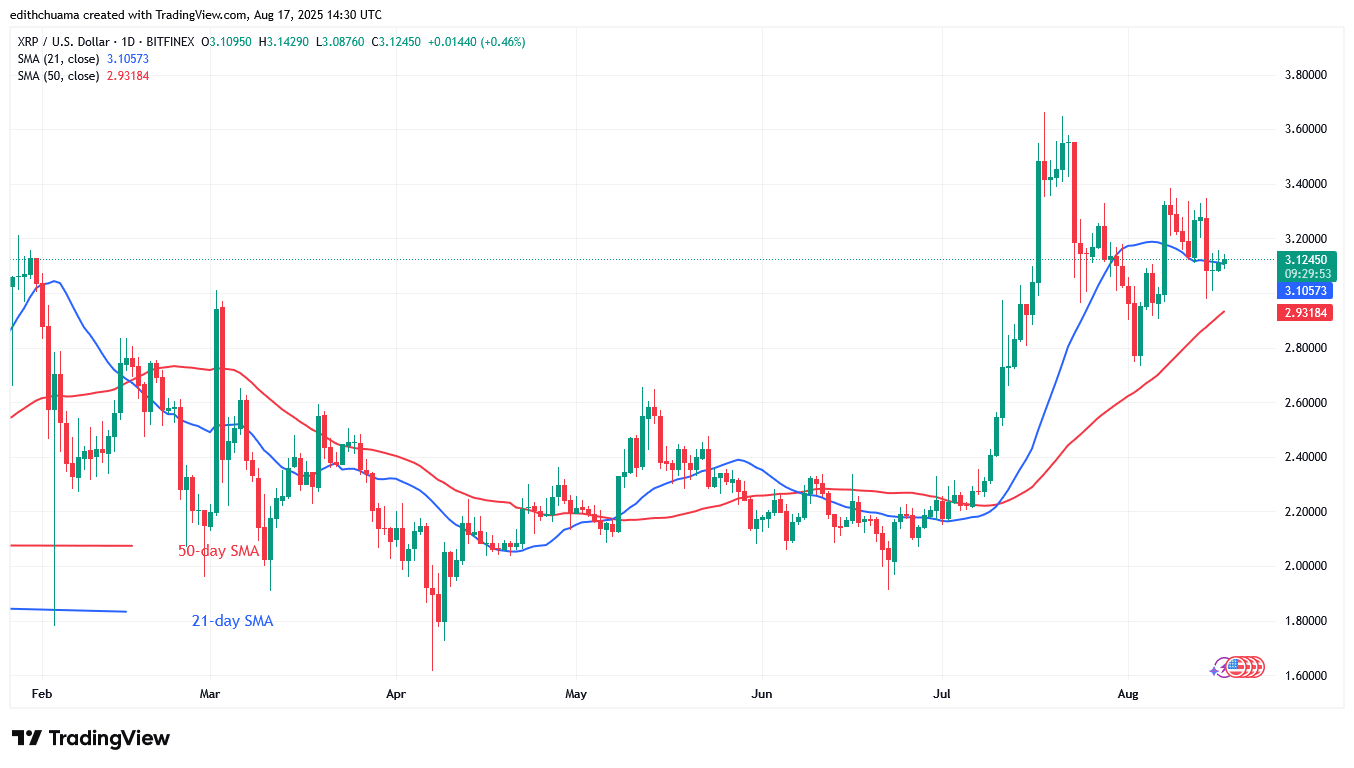
The price of XRP turns down twice at the $3.60 barrier but holds above the $3.00 low. The altcoin has halted its drop after reaching a low above the $2.80 support level. The cryptocurrency asset has corrected upward, although this has been hampered by resistance at $3.40. The price of XRP is currently between the $2.80 support level and the $3.40 barrier.
XRP has fallen below the 21-day SMA support. Today, the bulls are trying to keep the price above the 21-day SMA barrier. Meanwhile, XRP is trading above the 50-day SMA support but below the 21-day SMA. XRP will rise to its previous levels if the bulls retake the 21-day SMA support. Altcoin will drop to $2.80 if the price of the crypto drops below the 21-day SMA. The current price of XRP is $3.12.
Technical indicators
Key Resistance Levels: $2.50, $3.00, $3.50
Key Support Levels: $1.50, $1.00, $0.50
Daily Chart Indicators Reading:
On August 14, the cryptocurrency price slipped between the moving averages. Bulls bought the dips and are seeking to bring the price back above the 21-day SMA support. The price of the cryptocurrency is above the 50-day SMA support but below the 21-day SMA barrier. The Doji candlesticks cause the altcoin to move inside a range.
XRP/USD Medium-term Trend: Ranging
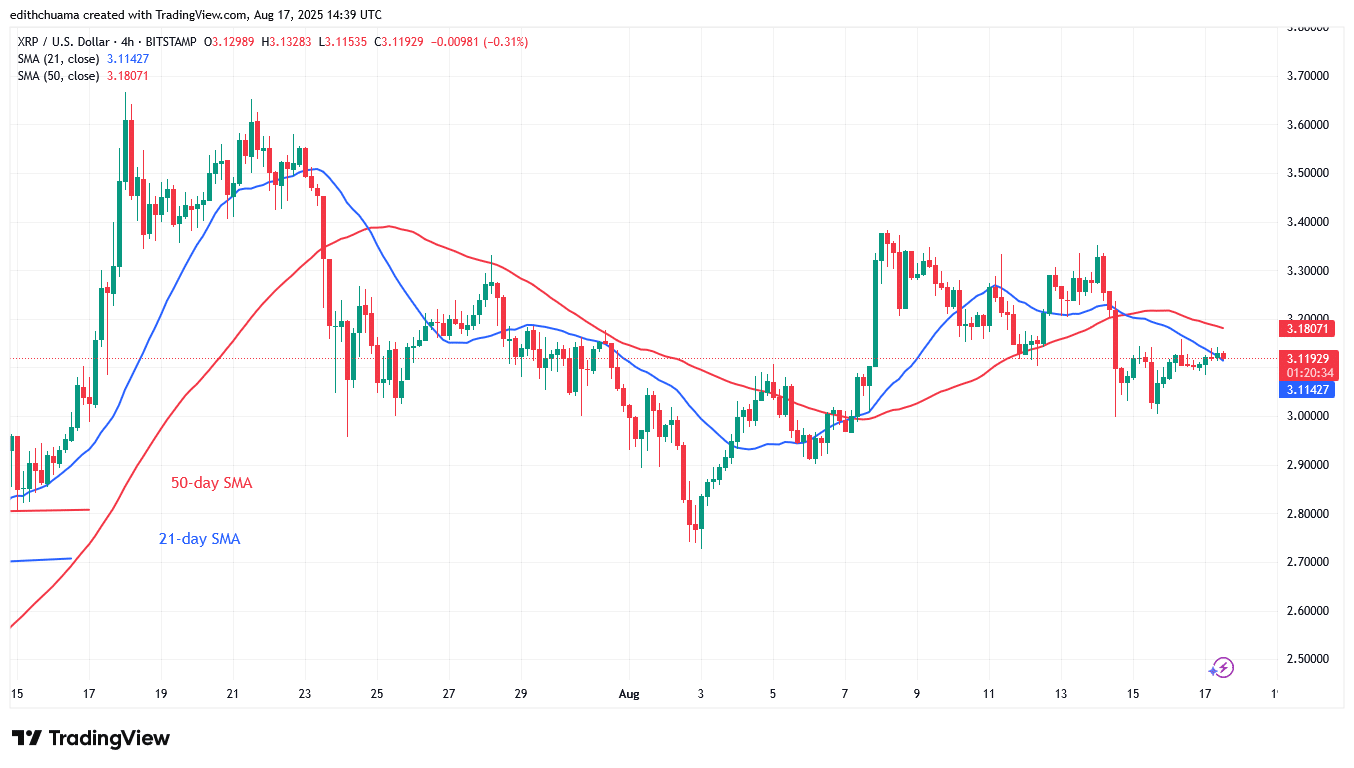
The price of XRP is trading sideways and slipping below the moving average lines. The crypto price has been repelled twice at the $3.40 level, with the altcoin falling below the moving average lines. XRP is presently trading below the $3.40 high but above the $3.00 support. The crypto price is still below the moving average lines, but it is consolidating above the $3.00 support.
4- Chart Indicators Reading
The horizontal moving average lines are underneath the price bars. The price bars form Doji candlesticks, which consolidate below the moving average lines. The XRP price will consolidate above the $3.00 support as Doji candlesticks appear. The 21-day SMA is lower than the 50-day SMA, indicating a recent fall.
General Outlook for Ripple (XRP)
The XRP price has been moving sideways below the $3.40 barrier, although it holds above the $3.00 low. The crypto price has dipped past the $3.00 support level, resuming consolidation above it. The price action is characterized by Doji candlesticks, which cause the altcoin to move horizontally. The crypto signal becomes range-bound as the altcoin remains in a confined range.
Make money without lifting your fingers: Start using a world-class auto trading solution.
Note: Learn2.Trade is not a financial advisor. Do your research before investing your funds in any financial asset, product, or event. We are not responsible for your investment results.
- Broker
- Min Deposit
- Score
- Visit Broker

- Award-winning Cryptocurrency trading platform
- $100 minimum deposit,
- FCA & Cysec regulated

- 20% welcome bonus of upto $10,000
- Minimum deposit $100
- Verify your account before the bonus is credited
- Fund Moneta Markets account with a minimum of $250
- Opt in using the form to claim your 50% deposit bonus
Learn to Trade
Never Miss A Trade Again

Signal Notification
Real-time signal notifications whenever a signal is opened, closes or Updated

Get Alerts
Immediate alerts to your email and mobile phone.

Entry Price Levels
Entry price level for every signal Just choose one of our Top Brokers in the list above to get all this free.