XRP/USD Long-term Trend: Bearish
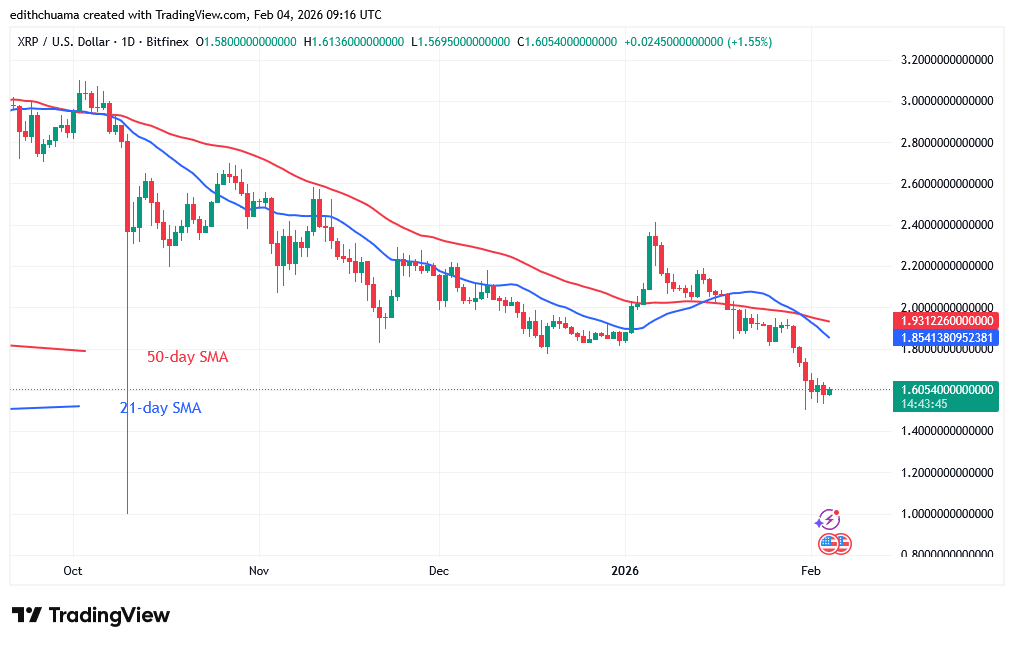
The XRP price is still dropping below $1.65, reaching a low of $1.50 on December 31. Bulls have bought the dips, compelling the altcoin to trade in a narrow range above the $1.50 support. The price’s upward movement has been capped below the $1.70 high. Doji candlesticks have reappeared as the altcoin consolidates above the $1.50 support level.
On the negative, if the bears break the $1.50 support, the cryptocurrency price would fall to a low of $1.24. However, the bearish momentum is anticipated to continue until the October 10 price level of $1.00. Today, XRP is worth $1.59.
Technical indicators
Key Resistance Levels: $2.50, $3.00, $3.50
Key Support Levels: $1.50, $1.00, $0.50
Daily Chart Indicators Reading:
On January 2, the 21-day SMA surpassed the 50-day SMA as the cryptocurrency price surged above the moving average lines. However, the 21-day SMA has fallen below the 50-day SMA support as the cryptocurrency price fell below the moving average lines. The extended candlestick wicks indicate strong buying pressure at the $1.50 support.
XRP/USD Medium-term Trend: Ranging
The XRP price has fallen and stalled above the $1.50 support. On the 4-hour chart, the cryptocurrency price is fluctuating above the $1.55 support and below the 21-day SMA barrier, or the resistance at $1.65. The 21-day SMA barrier has limited rising movements for the past five days. This suggests that the coin may be losing value.
4- Chart Indicators Reading
The 21-day and 50-day SMAs have dropped significantly to the bottom of the chart. The price bars are made up of a Doji candlestick that consolidates above the present support but below the 21-day SMA barrier. There are also long candlestick tails pointing across the $1.55 support level, indicating strong buying interest at lower prices.
General Outlook for Ripple (XRP)
The XRP price is still dropping below $1.65 but has paused above the $1.50 support. If the cryptocurrency loses its current support, it is likely to fall to the next support level of $1.24. The price movement has been motionless as it faces rejection at the 21-day SMA barrier on the 4-hour chart. The cryptocurrency signal is negative, with further rejection at the $1.65 high.
Make money without lifting your fingers: Start using a world-class auto trading solution.
Note: Learn2.Trade is not a financial advisor. Do your research before investing your funds in any financial asset, product, or event. We are not responsible for your investment results.
- Broker
- Min Deposit
- Score
- Visit Broker

- Award-winning Cryptocurrency trading platform
- $100 minimum deposit,
- FCA & Cysec regulated

- 20% welcome bonus of upto $10,000
- Minimum deposit $100
- Verify your account before the bonus is credited
- Fund Moneta Markets account with a minimum of $250
- Opt in using the form to claim your 50% deposit bonus
Learn to Trade
Never Miss A Trade Again

Signal Notification
Real-time signal notifications whenever a signal is opened, closes or Updated

Get Alerts
Immediate alerts to your email and mobile phone.

Entry Price Levels
Entry price level for every signal Just choose one of our Top Brokers in the list above to get all this free.