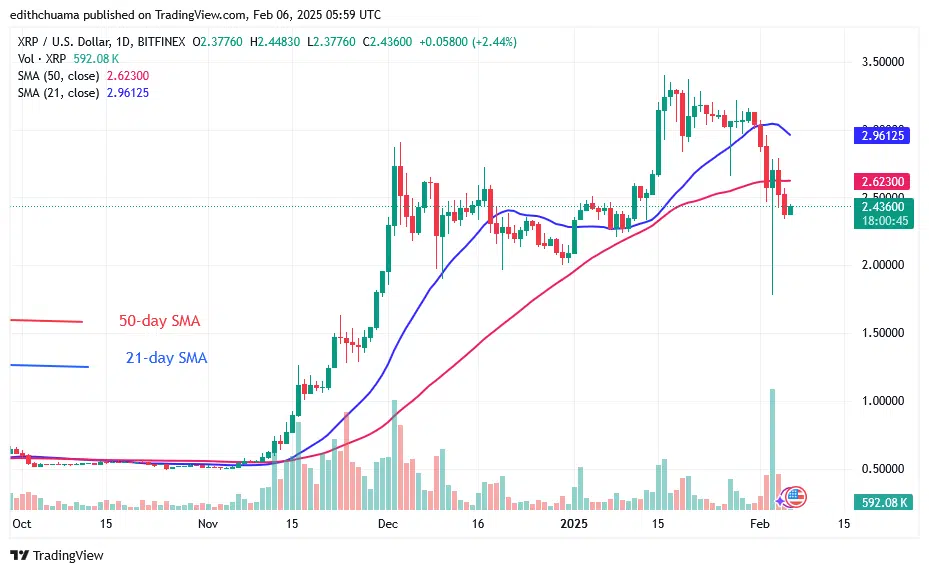
XRP/USD Long-term Trend: Bearish
The price of XRP drops below the moving average lines and recovers above the $2.20 support. The cryptocurrency asset had reached a high of $3.40 before getting stuck at the most recent high. XRP maintained its upward trajectory above the 21-day SMA until January 31, just before the decline. The bulls bought the dips on February 3, even though the bearish momentum peaked at $1.78.
XRP started a range-bound move below the moving average lines after recovering above the $2.20 support. The altcoin is correcting upward as it approaches the 50-day SMA. Selling pressure will resume if XRP drops below the 50-day SMA. The altcoin will drop to its previous low of $1.78 if it breaks below $2.20. At the time of writing, XRP is trading at $2.44.
Technical indicators
Key Resistance Levels: $2.50, $3.00, $3.50
Key Support Levels: $1.50, $1.00, $0.50
Daily Chart Indicators Reading:
Following the February 3 breakdown, the XRP price bars are below the moving average lines. The candlestick’s extended tail on February 3 points to the $1.78 support. At the $1.678 support, it suggests significant buying pressure. Despite the present drop, the moving average lines are sliding north.
XRP/USD Medium-term Trend: Bearish
The altcoin is trending lower as it broke below the moving average lines. The altcoin reached a low of $1.76 after hitting the 21-day SMA. The upward corrective was denied when it struck the 21-day SMA resistance. The selling pressure has paused above the $2.20 support as the altcoin fluctuates below the moving average lines.
The selling pressure may reappear if the $2.20 support is breached. The bullish trend will resume above the moving average lines.
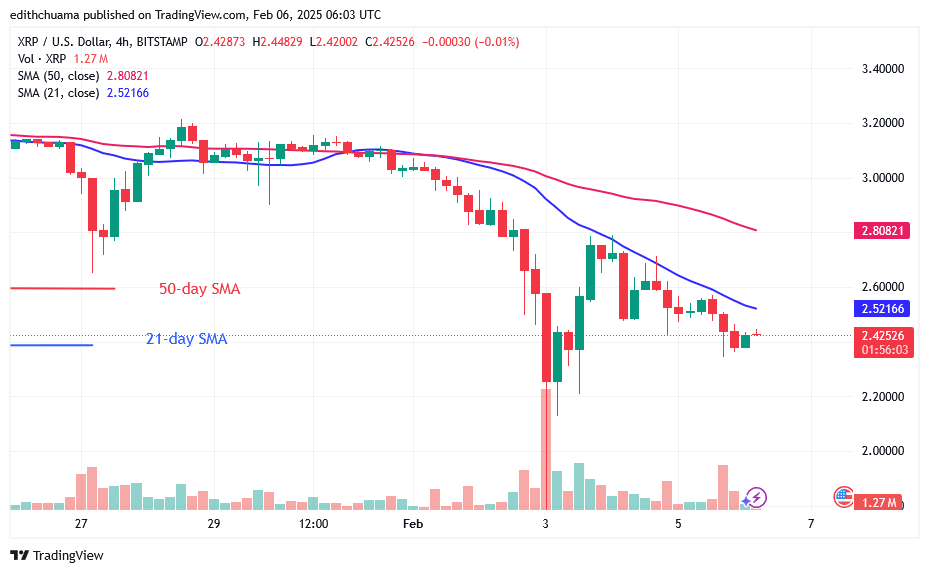
4-hour Chart Indicators Reading
The 21-day SMA is the price bars’ resistance line, and the moving average lines are trending south. The long tails of the candlesticks point down. As the altcoin keeps fluctuating below the moving average lines, the Doji candlesticks are starting to develop.
General Outlook for Ripple (XRP)
XRP recovers above the $2.20 support and commences a sideways move. However, the upward corrective is also being rejected by the 21-day SMA resistance. The altcoin will consistently remain above the $2.40 support following rejection. The altcoin is rising today as it reaches the 21-day SMA resistance. Currently, the crypto signal is range-bound as long as the altcoin remains above $2.20.
Make money without lifting your fingers: Start using a world-class auto trading solution.
Note: Learn2.Trade is not a financial advisor. Do your research before investing your funds in any financial asset or presented product or event. We are not responsible for your investing results.
- Broker
- Min Deposit
- Score
- Visit Broker

- Award-winning Cryptocurrency trading platform
- $100 minimum deposit,
- FCA & Cysec regulated

- 20% welcome bonus of upto $10,000
- Minimum deposit $100
- Verify your account before the bonus is credited
- Fund Moneta Markets account with a minimum of $250
- Opt in using the form to claim your 50% deposit bonus
Learn to Trade
Never Miss A Trade Again

Signal Notification
Real-time signal notifications whenever a signal is opened, closes or Updated

Get Alerts
Immediate alerts to your email and mobile phone.

Entry Price Levels
Entry price level for every signal Just choose one of our Top Brokers in the list above to get all this free.