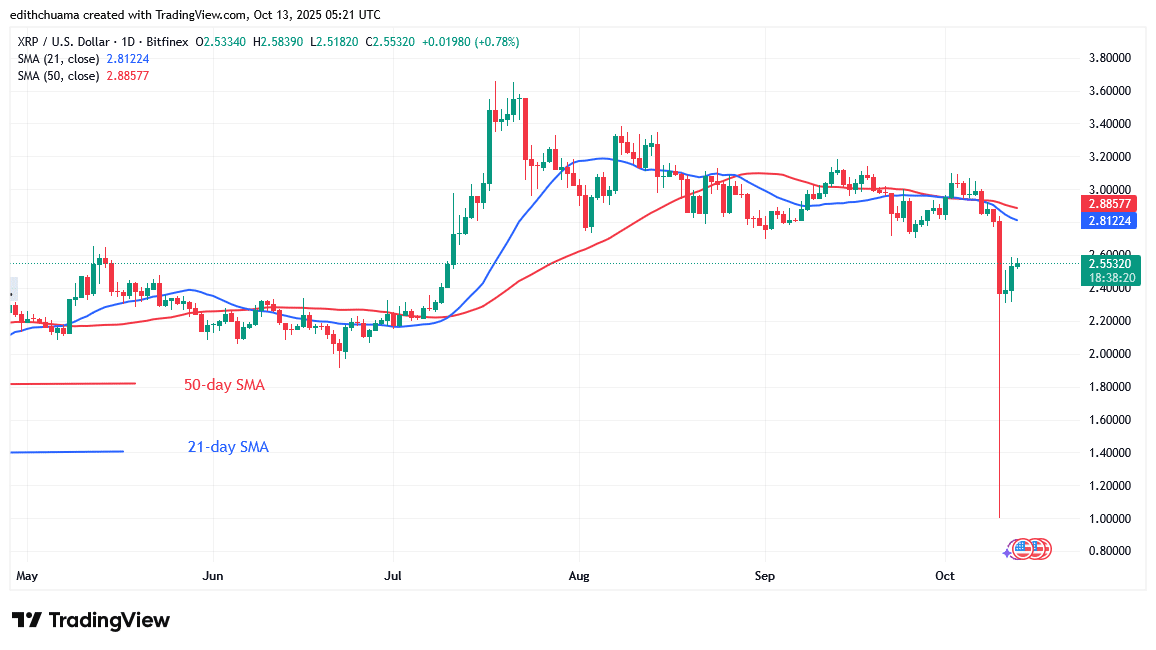
XRP/USD Long-term Trend: Bearish
The price of XRP drops to $1.00 but bounces back above $2.30. XRP was trading sideways between the $2.70 support and the $3.20 resistance until it crashed. On October 2, the upward surge was halted by the $3.10 barrier, causing the cryptocurrency to fall below the moving averages. On October 10, XRP fell sharply to $1.00, but the bulls purchased the dips. The cryptocurrency asset retreated and then regained above $2.30.
XRP is currently trading in a range between the $2.30 support level and the moving average lines. However, the rally has come to a halt near the $2.60 high. On the upside, XRP will resume its bullish trend if buyers maintain the price above the moving average lines. XRP currently trades at $2.55.
Technical indicators
Key Resistance Levels: $2.50, $3.00, $3.50
Key Support Levels: $1.50, $1.00, $0.50
Daily Chart Indicators Reading:
On October 10, XRP fell quickly to a low of $1.00, leaving behind a long candlestick tail. The extended candlestick tail implies significant buying pressure at the $1.00 support level. The moving average lines slope horizontally, with the 21-day SMA below the 50-day SMA.
XRP/USD Medium-term Trend: Bearish
The cryptocurrency asset has recovered above the $2.30 support level on the 4-hour chart. Since October 10, the cryptocurrency price has fluctuated above the $2.30 support level but below the moving average lines. Today’s bullish momentum breached and finished above the 21-day SMA. The cryptocurrency price is consolidating above the 21-day SMA support, while the trend is being determined.
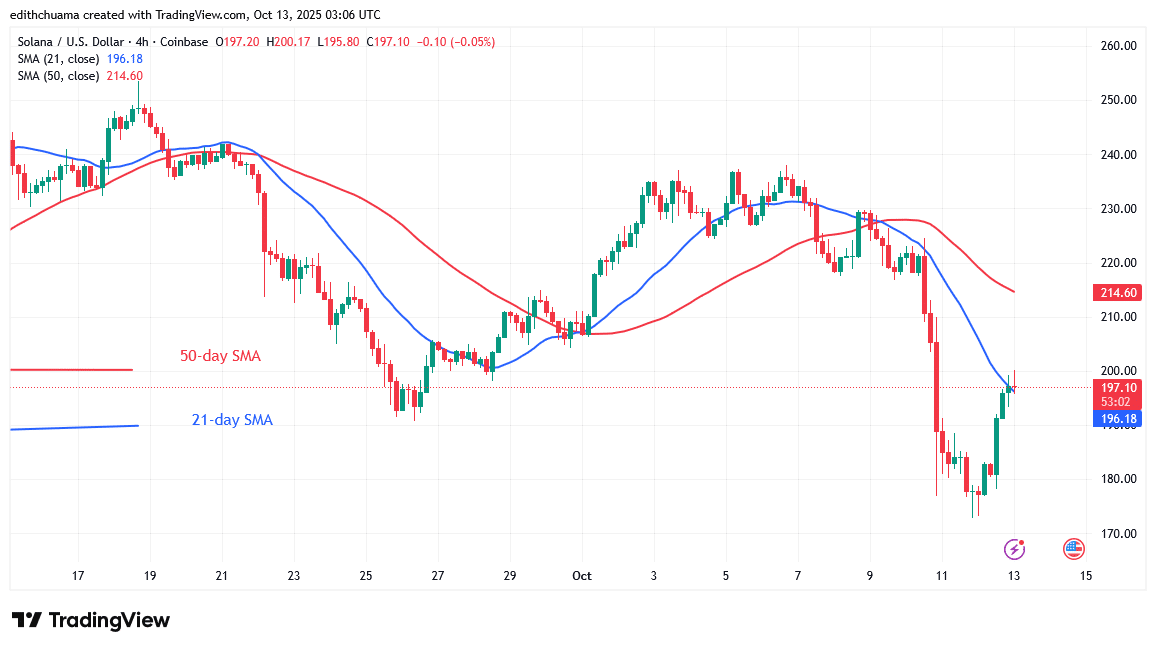
4- Chart Indicators Reading
The cryptocurrency price is trading above the 21-day SMA support but below the 50-day SMA barrier. On the upside, a break above the 50-day SMA will signify the continuation of the bullish trend. There is also a long candlestick tail across the $1.00 support, indicating strong buying interest at a lower price level.
General Outlook for Ripple (XRP)
The XRP price is recovering after falling to a low of $1.00, but bounces back above $2.30. The altcoin has risen above the $2.30 support level as it corrects upward. If the current support holds, the cryptocurrency will trade in a range of $2.30 to $3.20. Today, the positive momentum broke above the 21-day SMA, indicating that the cryptocurrency could rise. Meanwhile, the cryptocurrency signal will be good as long as buyers maintain the price above the moving average lines.
Make money without lifting your fingers: Start using a world-class auto trading solution.
Note: Learn2.Trade is not a financial advisor. Do your research before investing your funds in any financial asset, product, or event. We are not responsible for your investment results.
- Broker
- Min Deposit
- Score
- Visit Broker

- Award-winning Cryptocurrency trading platform
- $100 minimum deposit,
- FCA & Cysec regulated

- 20% welcome bonus of upto $10,000
- Minimum deposit $100
- Verify your account before the bonus is credited
- Fund Moneta Markets account with a minimum of $250
- Opt in using the form to claim your 50% deposit bonus
Learn to Trade
Never Miss A Trade Again

Signal Notification
Real-time signal notifications whenever a signal is opened, closes or Updated

Get Alerts
Immediate alerts to your email and mobile phone.

Entry Price Levels
Entry price level for every signal Just choose one of our Top Brokers in the list above to get all this free.