XRP/USD Long-term Trend: Bearish
XRP’s price slips below its moving average lines and continues its slide to a low of $2.70. When the cryptocurrency is in a bearish trend zone, it tends to plummet. Today, the altcoin is sliding after being repelled twice by the moving average lines. The selling pressure has slowed as a result of the Doji Candlesticks.
Today, the altcoin has dropped to a low of $2.82. Nonetheless, since August 2, the cryptocurrency has traded above the crucial support of $2.70. On the downside, if the bears violate the $2.70 support level, XRP will fall to a low of $1.85. Meanwhile, the altcoin is steadily sliding to the downside. Altcoin is falling steadily to the downside.
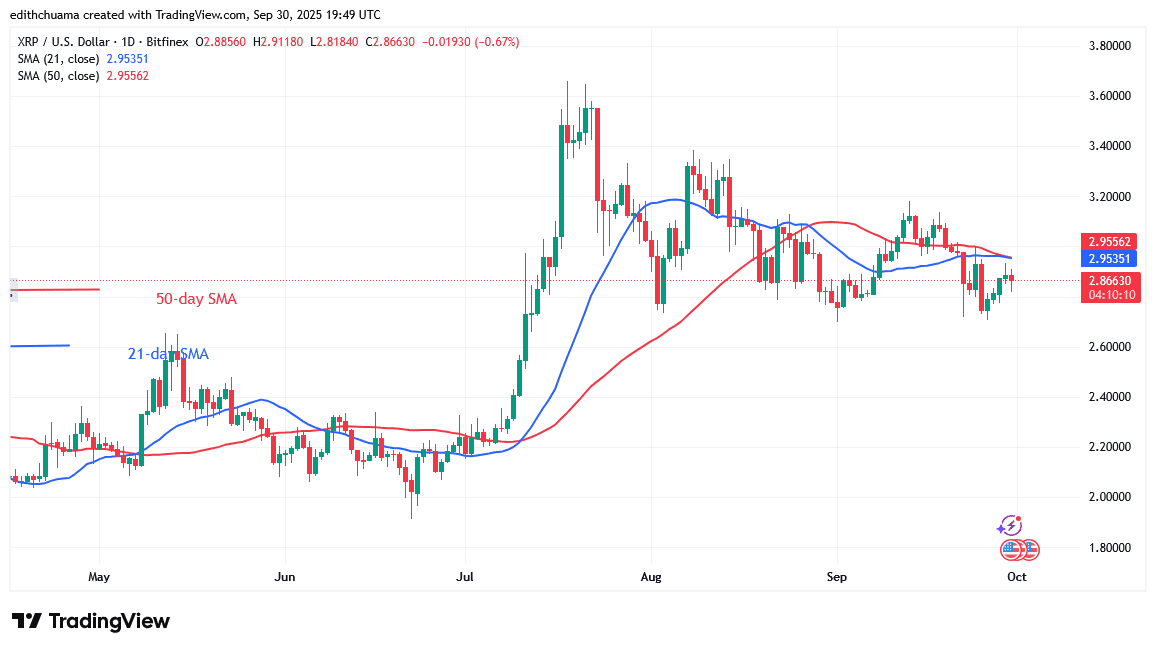
Technical indicators
Key Resistance Levels: $2.50, $3.00, $3.50
Key Support Levels: $1.50, $1.00, $0.50
Daily Chart Indicators Reading:
The 21-day and 50-day moving average lines are horizontally flat, suggesting a sideways trend. The 21-day SMA is below the 50-day SMA, signaling a bearish trend. Price movement has been steady due to the existence of Doji Doji candlesticks.
XRP/USD Medium-term Trend: Bearish
On the 4-hour chart, XRP has been declining since September 13. The cryptocurrency price is experiencing a pattern of lower highs and higher lows. On the downside, the altcoin has stabilized above the $2.70 level. It is trading above the $2.70 support level and below the moving average lines, which represent $3.00 resistance. XRP is falling toward its current support of $2.70.
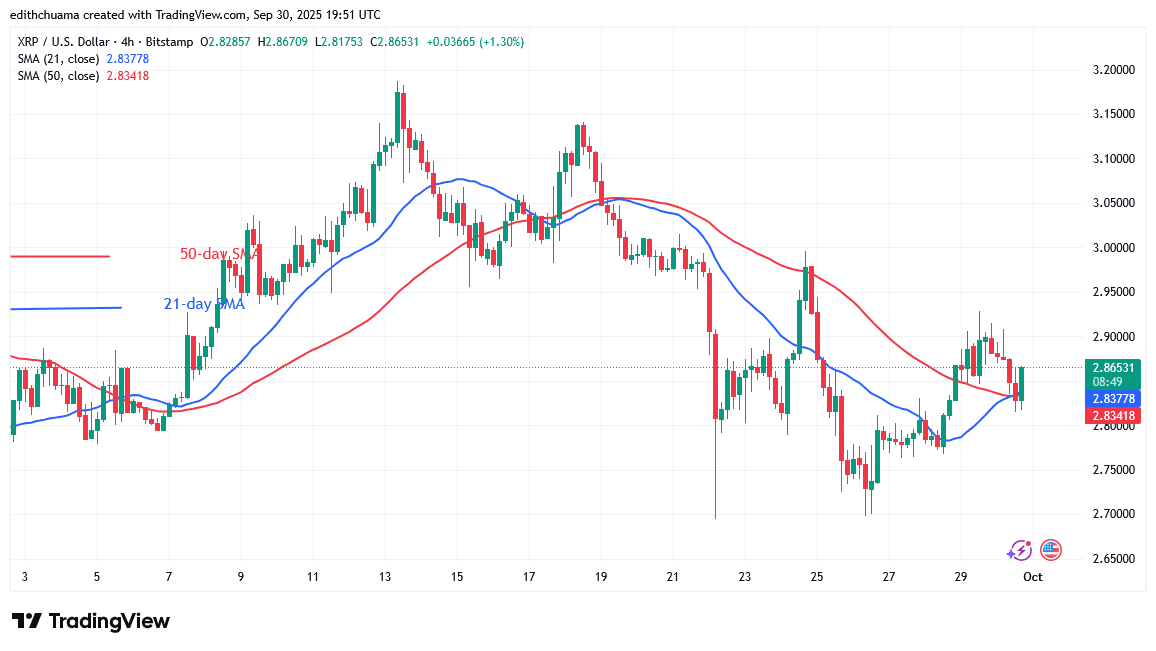
4- Chart Indicators Reading
The moving average lines have a downward slope, indicating a bearish trend. The 21-day SMA is above the 50-day SMA in a declining trend. The cryptocurrency price fluctuates both below and above the moving average lines. There is a long candlestick tail point across the present support level of $2.70. It suggests considerable buying pressure at a lower price point.
General Outlook for Ripple (XRP)
XRP is continuing its downward trend, falling to a low of $2.70. The altcoin is trading between $2.70 and $3.00, with the latter acting as resistance. XRP is sliding after encountering resistance near $3.00. If the bears breach the $2.70 support level, the cryptocurrency signal will be bearish.
Make money without lifting your fingers: Start using a world-class auto trading solution.
Note: Learn2.Trade is not a financial advisor. Do your research before investing your funds in any financial asset, product, or event. We are not responsible for your investment results.
- Broker
- Min Deposit
- Score
- Visit Broker

- Award-winning Cryptocurrency trading platform
- $100 minimum deposit,
- FCA & Cysec regulated

- 20% welcome bonus of upto $10,000
- Minimum deposit $100
- Verify your account before the bonus is credited
- Fund Moneta Markets account with a minimum of $250
- Opt in using the form to claim your 50% deposit bonus
Learn to Trade
Never Miss A Trade Again

Signal Notification
Real-time signal notifications whenever a signal is opened, closes or Updated

Get Alerts
Immediate alerts to your email and mobile phone.

Entry Price Levels
Entry price level for every signal Just choose one of our Top Brokers in the list above to get all this free.