XRP/USD Long-term Trend: Bearish
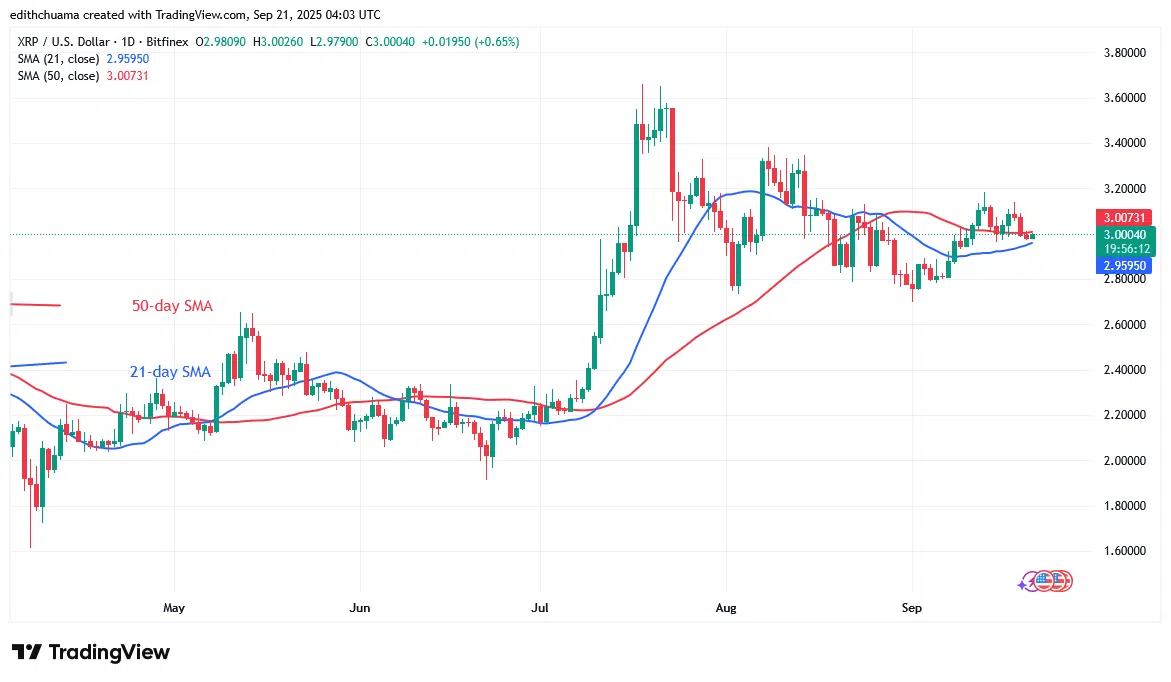
XRP’s price is falling as it continues its slide below $3.20. Buyers attempted to push the price above $3.20, but were repulsed. The second bullish momentum was dashed at the $3.10 high. Today, XRP fell below the 50-day SMA, indicating a further slide in the cryptocurrency. XRP has fallen above the 21-day SMA but below the 50-day SMA. Further higher movement of the crypto asset is unlikely as the altcoin loses its 50-day SMA support.
On the downside, selling pressure will resume if the bears break below the 21-day SMA support. XRP will fall to its next support at $2.70. The altcoin is now valued $2.98 as of this writing.
Technical indicators
Key Resistance Levels: $2.50, $3.00, $3.50
Key Support Levels: $1.50, $1.00, $0.50
Daily Chart Indicators Reading:
Horizontal moving average lines indicate a sideways trend. However, the price bars are located between the moving average lines. The price bars are denominated with a Doji, or candlestick, causing the cryptocurrency to move steadily. The 21-day SMA is lower than the 50-day SMA, indicating that the market is now declining.
XRP/USD Medium-term Trend: Bearish
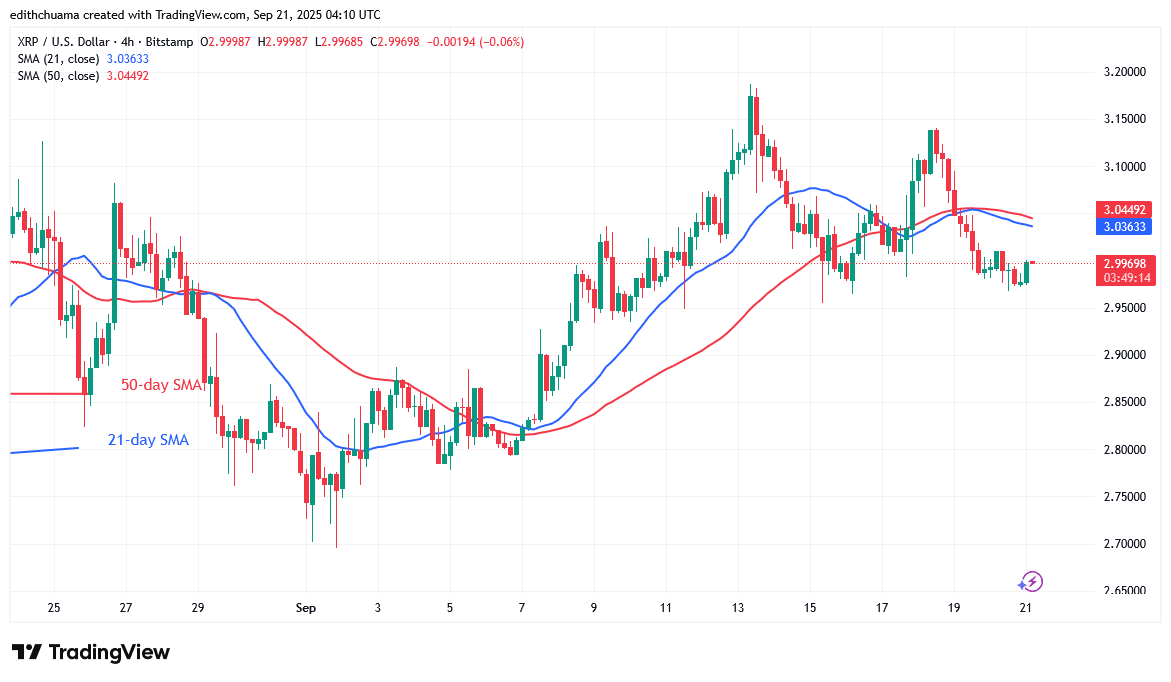
The cryptocurrency asset is in a sideways trend on the 4-hour chart. The cryptocurrency is trading above the $2.95 support level but below the $3.20 peak. XRP has slipped below the moving average lines after failing to break through the $3.20 resistance. The cryptocurrency price has fallen below the $3.00 support level and may continue to decrease.
4- Chart Indicators Reading
The 21-day and 50-day SMAs are trending downward. As the cryptocurrency drops, the 21-day SMA has dipped below the 50-day SMA. The price bars are below the moving average lines, indicating a decline.
General Outlook for Ripple (XRP)
XRP is in a downtrend as it continues its slide below $3.20. On the daily chart, the altcoin will continue to fluctuate because it is caught between two moving average lines. However, the bears have broken through the critical support at $3.00. The cryptocurrency signal is unfavorable as bears broke below the moving average lines.
Make money without lifting your fingers: Start using a world-class auto trading solution.
Note: Learn2.Trade is not a financial advisor. Do your research before investing your funds in any financial asset, product, or event. We are not responsible for your investment results.
- Broker
- Min Deposit
- Score
- Visit Broker

- Award-winning Cryptocurrency trading platform
- $100 minimum deposit,
- FCA & Cysec regulated

- 20% welcome bonus of upto $10,000
- Minimum deposit $100
- Verify your account before the bonus is credited
- Fund Moneta Markets account with a minimum of $250
- Opt in using the form to claim your 50% deposit bonus
Learn to Trade
Never Miss A Trade Again

Signal Notification
Real-time signal notifications whenever a signal is opened, closes or Updated

Get Alerts
Immediate alerts to your email and mobile phone.

Entry Price Levels
Entry price level for every signal Just choose one of our Top Brokers in the list above to get all this free.