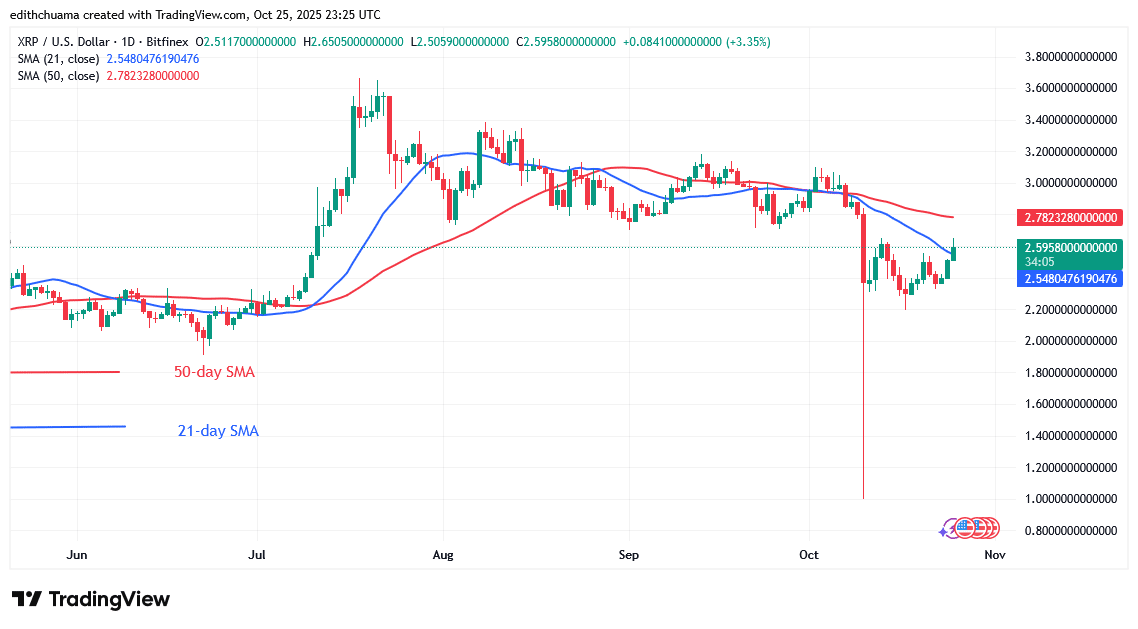
XRP/USD Long-term Trend: Bearish
The XRP price rises above $2.20 but hits the $2.65 barrier. Prices have been falling since October 10. XRP has been drifting sideways, above the $2.20 support but below the moving average lines. Today, the cryptocurrency price is aiming to break above the 21-day SMA. If the cryptocurrency breaks above the 21-day SMA barrier, it will ascend to the next resistance level at the 50-day SMA.
On the upside, if buyers can sustain the price above the moving average lines, XRP will test past highs of $3.20 and $3.60. In contrast, XRP will return to its range above the $2.20 support, where it failed to break above the 21-day SMA barrier. XRP is now valued $2.59 at the time of writing.
Technical indicators
Key Resistance Levels: $2.50, $3.00, $3.50
Key Support Levels: $1.50, $1.00, $0.50
Daily Chart Indicators Reading:
The XRP price has broken above the 21-day SMA barrier. It means that XRP has recovered its bullish momentum. If the 50-day SMA barrier is not broken, the altcoin will be compelled to move in a range between the moving average lines. In the meantime, the moving average lines are horizontal, indicating a sideways trend.
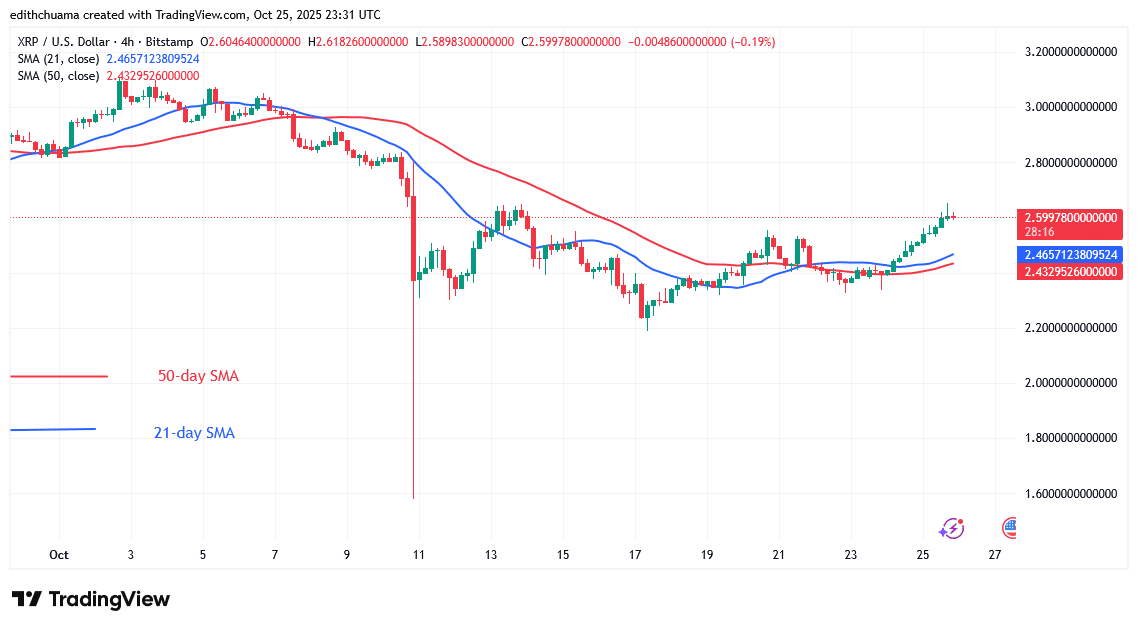
XRP/USD Medium-term Trend: Bullish
On the 4-hour chart, the XRP price has broken above the moving average lines, indicating that the altcoin will continue to trade horizontally. The altcoin has traded sideways between $2.20 and $2.70. Bullish momentum has been halted near $2.65. If the initial barrier is broken, XRP will continue its positive upward trend, reaching a high of $3.20. If the altcoin fails to break its previous high, the sideways trend will continue above $2.20.
4- Chart Indicators Reading
The price bars are located above the horizontal moving average lines. The 21-day SMA exceeds the 50-day SMA, indicating a trend. The altcoin’s price will rise as long as it remains above the moving average lines. Currently, the crypto price is moving gradually, dominated by Doji candlesticks.
General Outlook for Ripple (XRP)
XRP breaks above the 21-day SMA level but hits the $2.65 barrier. However, the price movement is restricted due to the existence of Doji candlesticks. The cryptocurrency price is having difficulty breaking through the resistance at $2.65. The cryptocurrency has been repelled three times at the recent peak. Meanwhile, the crypto signal will be bullish if the cryptocurrency price breaks and closes above the 21-day SMA.
Make money without lifting your fingers: Start using a world-class auto trading solution. Note: Learn2.Trade is not a financial advisor. Do your research before investing your funds in any financial asset, product, or event. We are not responsible for your investment results
- Broker
- Min Deposit
- Score
- Visit Broker

- Award-winning Cryptocurrency trading platform
- $100 minimum deposit,
- FCA & Cysec regulated

- 20% welcome bonus of upto $10,000
- Minimum deposit $100
- Verify your account before the bonus is credited
- Fund Moneta Markets account with a minimum of $250
- Opt in using the form to claim your 50% deposit bonus
Learn to Trade
Never Miss A Trade Again

Signal Notification
Real-time signal notifications whenever a signal is opened, closes or Updated

Get Alerts
Immediate alerts to your email and mobile phone.

Entry Price Levels
Entry price level for every signal Just choose one of our Top Brokers in the list above to get all this free.