
STELLAR Price Analysis – March 31
When the bulls break up the resistance level of $0.42, the price will increase towards $0.50, and $0.57. In case the bears, breakdown the support level at $0.33, Stellar will decrease to $0.22 and $0.16 levels.
XLM/USD Market
Key Levels:
Resistance levels: $0.42, $0.50, $0.57
Support levels: $0.33, $0.22, $0.16
XLM/USD Long-term Trend: Ranging
Stellar continues on the ranging movement on the daily chart. The coin has been experiencing low volatility for more than three weeks. The bulls’ pressure is weak and could not break up the resistance level of $0.42. The bears’ pressure is not sufficient to penetrate the support level of $0.33, that is what make the ranging movement continues.
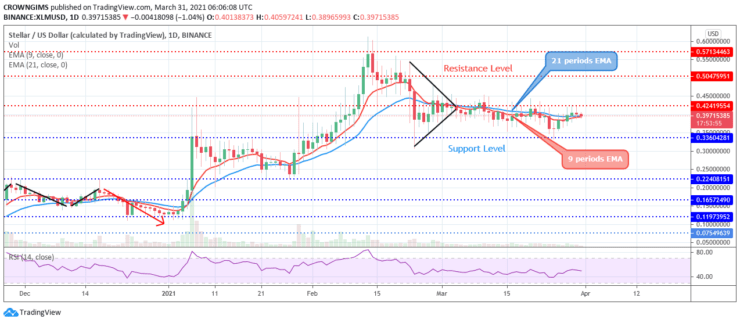
Stellar continues hovering over the two EMAs and the 9 periods EMA remains interlocked with the 21 periods EMA which indicate that consolidation continues in the XLM market. Breakout is eminent in the Stellars’ market. When the bulls break up the resistance level of $0.42, the price will increase towards $0.50, and $0.57. In case the bears, breakdown the support level at $0.33, Stellar will decrease to $0.22 and $0.16 levels. The relative strength index period 14 is exhibiting sell signal at 50 levels with the signal line bending down.
XLM/USD Medium-term Trend: Ranging
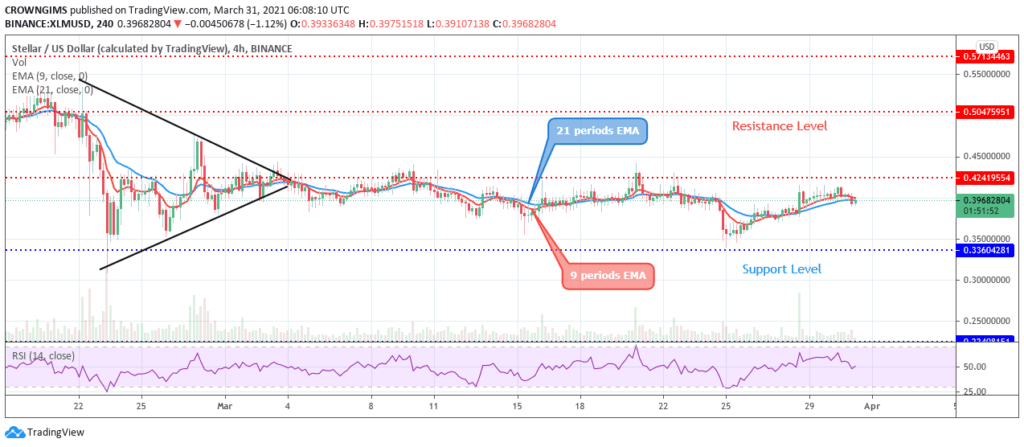
XLM is on the ranging movement in the 4-hour chart. The resistance level at $0.42 holds the price, likewise, the support level at $0.33 holds and the price awaiting a breakout. Stellar continues its trading within the $0.42 and $0.33 price level. The ranging movement may continue until the bulls’ pressure increase to break up the barrier at $0.42 or the bears’ pressure increase to break down the support level at $0.33.

The price is trading over and around the 9 periods EMA and 21 periods EMA with the two EMAs interlocked to each other. The Relative Strength Index period 14 is at 50 levels and the signal line is exhibiting sell signal.


