
Key Resistance Levels: 1.4200, 1.4400, 1.4600
Key Support Levels: 1.3400, 1.3200, 1.3000
USD/CAD Price Long-term Trend: Bearish
USD/CAD pair was in a downward move in March. On March 1, the pair was resisted at level 1.2700 and it plunged to level 1.2400. On March 18, the bulls bought the dips and resumed upward to reach the high of 1.2647. Presently, the currency pair is in a downward move.
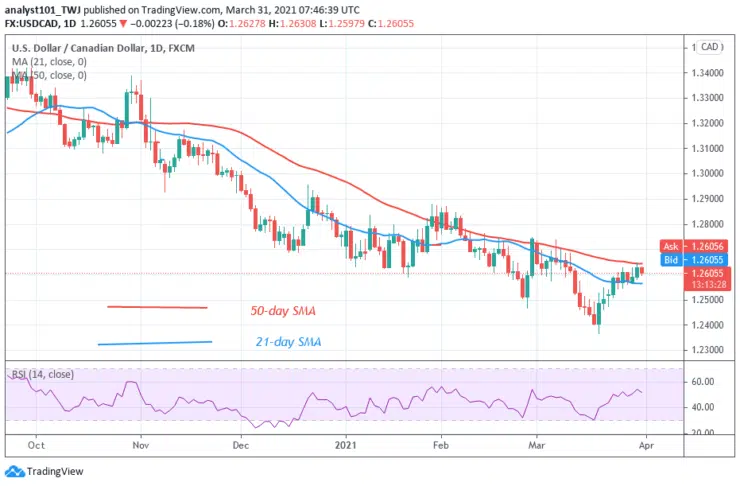
Daily Chart Indicators Reading:
The moving averages are sloping downward indicating the downtrend. USD/CAD is at level 51 of the Relative Strength Index period 14. It indicates that there is a balance between supply and demand.
USD/CAD Medium-term Trend: Bearish
On the 4-hour chart, the pair has been in a downward move. The pair retested level 1.2640 twice before the downward move. On March 31 downtrend; a retraced candle body tested the 61.8% Fibonacci retracement level. The retracement indicates that USD/CAD will fall to level 1.618 Fibonacci level or the low of 1.2586.


