Market Analysis – October 24
USOil sustains its downward drive after rejection within a critical supply range. The commodity continues to display a pronounced bearish inclination as valuation remains capped beneath the 9-day moving average near $58.790. The MACD profile shows a weak upward cross that remains below the neutral axis, indicating limited recovery potential and a persistent downward bias. Market dynamics reveal that distribution forces still outweigh accumulation efforts, with short-term rallies proving largely corrective. The broader positioning aligns with a declining consumption outlook, reinforcing the extended bearish sentiment across the energy complex.
USOil Key Levels
Resistance Levels: $61.50, $66.40, $72.20
Support Levels: $55.20, $52.00, $50.10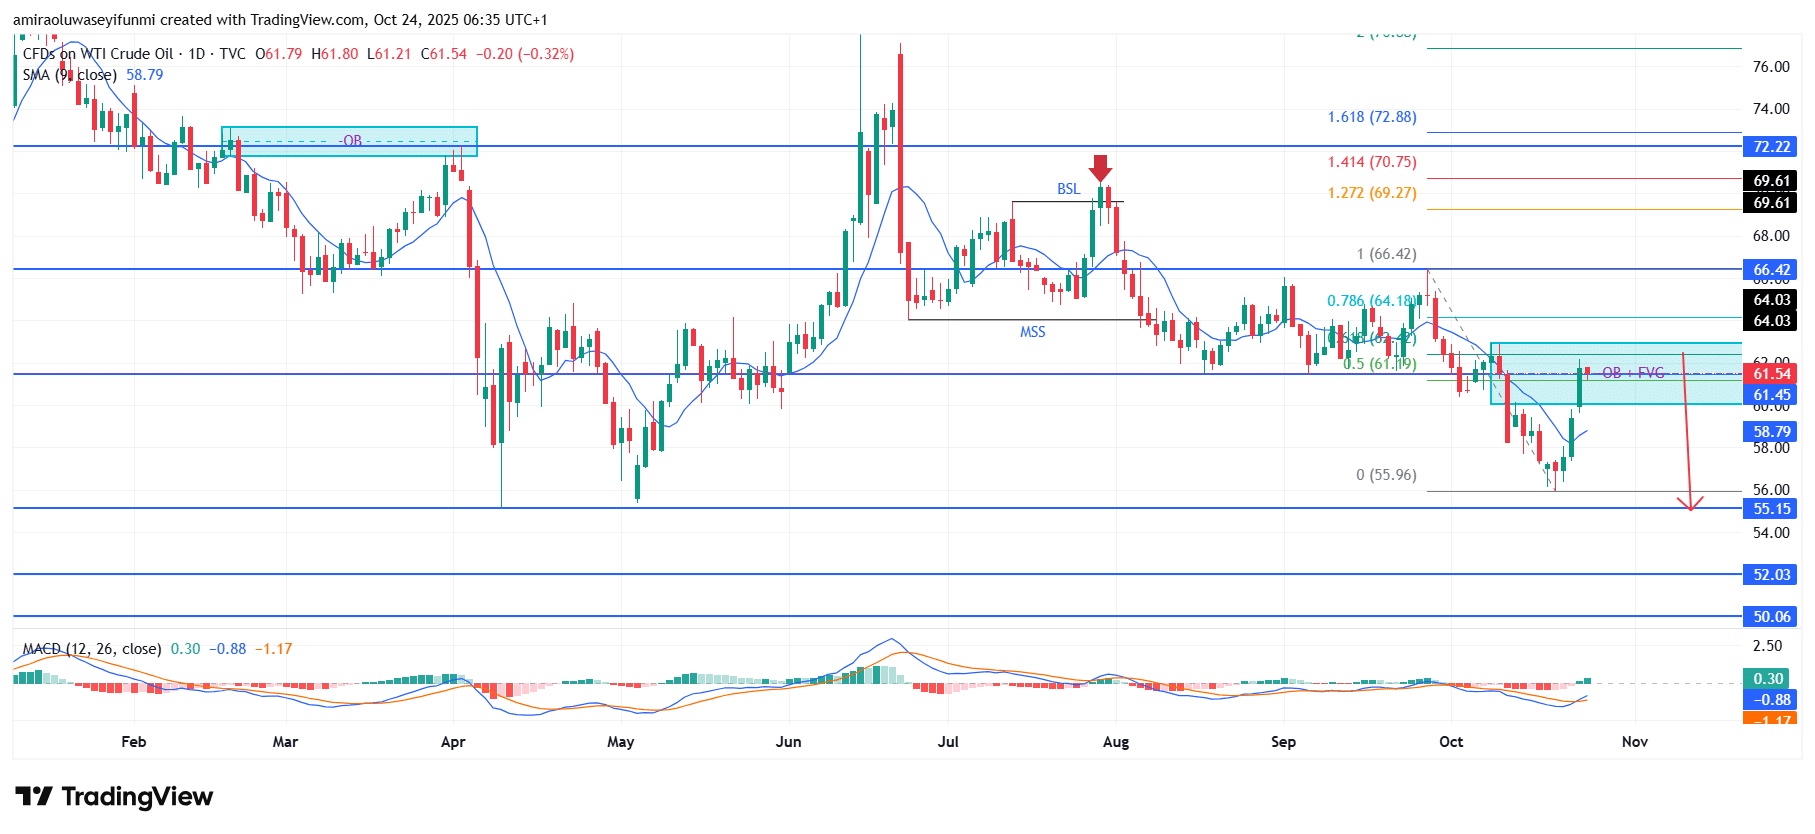
USOil Long-Term Trend: Bearish
From a structural perspective, the recent move into the $61.450–$64.000 corridor met firm resistance within the identified order block and fair value gap, halting the upward attempt. This zone also aligns with the 50–78.6% Fibonacci retracement cluster, forming a strong confluence of supply influence. The subsequent decline confirms renewed sell-side dominance, redirecting price action toward prior structural pivot zones. The earlier shift in market structure around $64.000 continues to act as a technical anchor that defines the prevailing downward trajectory.
Looking forward, USOil appears positioned to extend its retracement phase as long as price remains below $61.500. A clear drop beneath the interim threshold at $58.800 could invite further liquidation pressure toward $55.150, with extended targets near $52.000 if momentum intensifies. Any return to the $64.000 area may once again attract strong selling interest, reinforcing the bearish bias. The current chart setup, supported by fading momentum, suggests that downside continuation remains the more likely scenario. Traders monitoring forex signals may find this consistent bearish setup aligning with broader risk sentiment across the commodities market.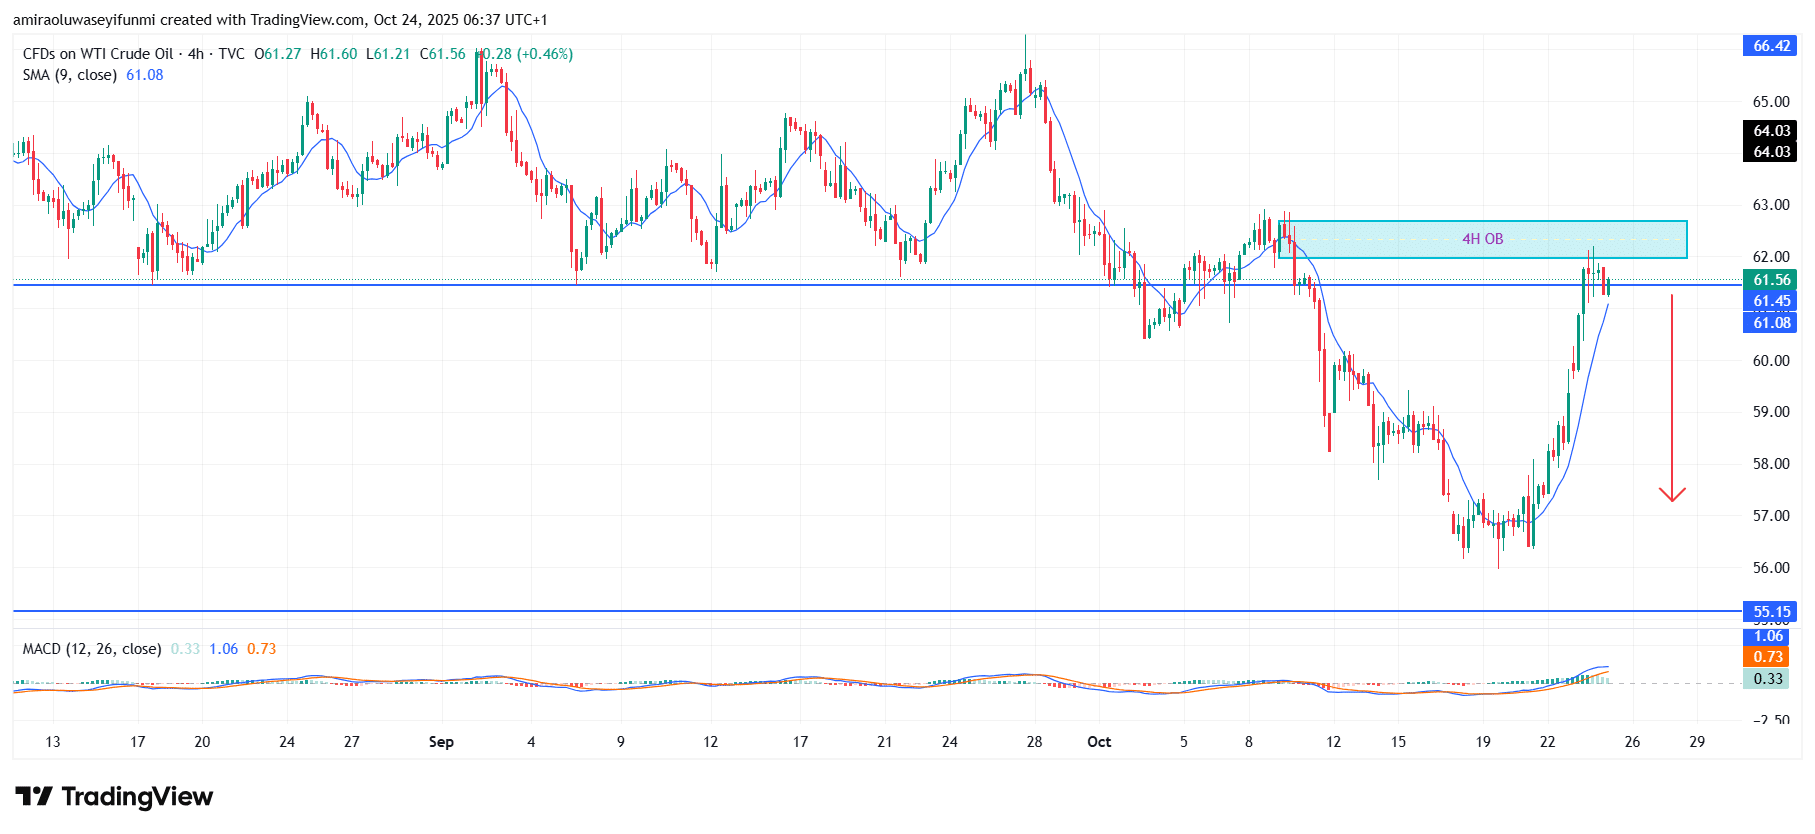
USOil Short-Term Trend: Bearish
USOil maintains a bearish outlook on the four-hour chart as price faces rejection from the $62.000 order block zone. The 9-period simple moving average near $61.080 serves as dynamic resistance, restricting additional upward attempts.
Momentum continues to weaken, with the MACD histogram showing early signs of fading bullish pressure. A confirmed breakdown below $61.000 could trigger further decline toward $55.150 in the upcoming sessions.
Make money without lifting your fingers: Start using a world-class auto trading solution
How To Buy Lucky Block
Note: Learn2.trade is not a financial advisor. Do your research before investing your funds in any financial asset, product, or event. We are not responsible for your investment results.
- Broker
- Min Deposit
- Score
- Visit Broker

- Award-winning Cryptocurrency trading platform
- $100 minimum deposit,
- FCA & Cysec regulated

- 20% welcome bonus of upto $10,000
- Minimum deposit $100
- Verify your account before the bonus is credited
- Fund Moneta Markets account with a minimum of $250
- Opt in using the form to claim your 50% deposit bonus
Learn to Trade
Never Miss A Trade Again

Signal Notification
Real-time signal notifications whenever a signal is opened, closes or Updated

Get Alerts
Immediate alerts to your email and mobile phone.

Entry Price Levels
Entry price level for every signal Just choose one of our Top Brokers in the list above to get all this free.