Market Analysis – November 21
USOil continues to face strong downside pressure as its technical structure weakens. The broader market sentiment remains firmly bearish, with price action consistently aligning with downward-pointing momentum indicators.
The MACD histogram remains below the zero line, while the signal lines show only a weak recovery, highlighting a steady decline in bullish interest. Price also holds below the short-term moving average, reflecting an ongoing inability to establish upward momentum. Altogether, these technical factors point to a market environment dominated by sellers, reducing the prospects of any meaningful corrective rise.
USOil Key Levels
Resistance Levels: $61.50, $66.40, $72.20
Support Levels: $55.20, $52.00, $50.10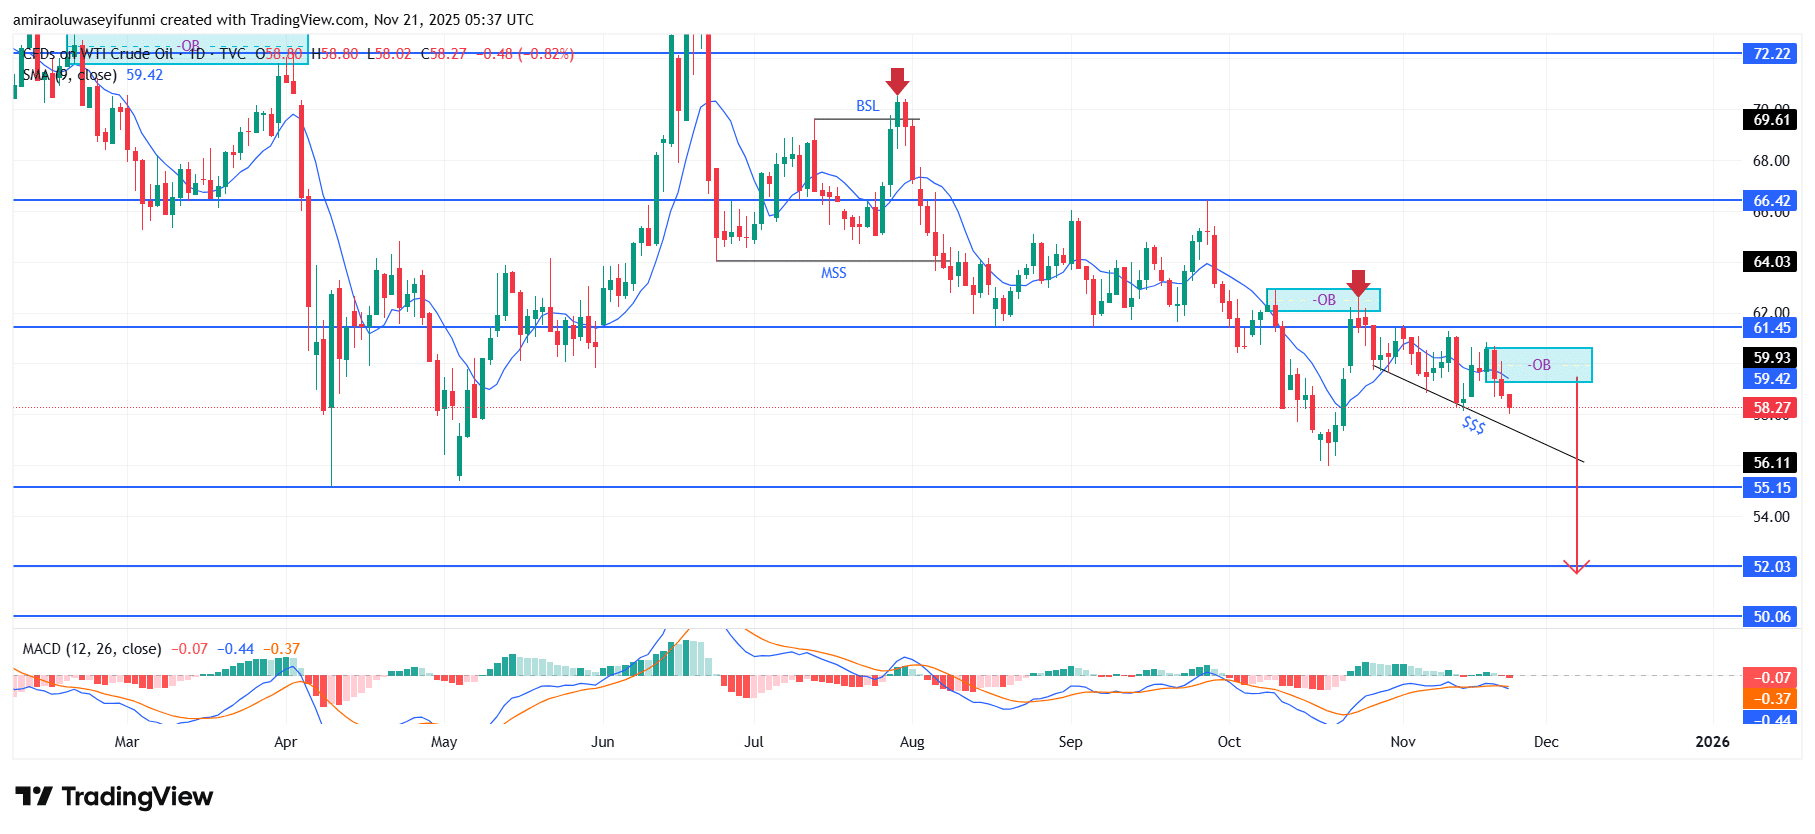
USOil Long-Term Trend: Bearish
From a price-action perspective, USOil has repeatedly rejected the overhead supply zone near $61.450, forming a series of bearish order blocks that confirm sustained institutional selling. The recent break in structure around the $59.000–$60.000 range signals a firm shift toward lower price territories. The descending trendline has also been respected multiple times, producing a sequence of lower highs that further strengthens the bearish outlook. With liquidity below $56.110 now exposed, the market is positioned to probe deeper inefficiencies created during earlier declines.
Looking ahead, the prevailing bearish order flow suggests an increased likelihood of continued downward movement. If sellers retain control, price may test the mid-range support at $55.150, and a breakdown there could drive momentum toward the liquidity zone near $52.000. Should bearish pressure extend beyond that point, a push toward $50.100 remains possible, especially if macroeconomic drivers align with ongoing supply-side factors. Overall, USOil appears set for further depreciation as structural and liquidity dynamics continue to favour sustained downward movement.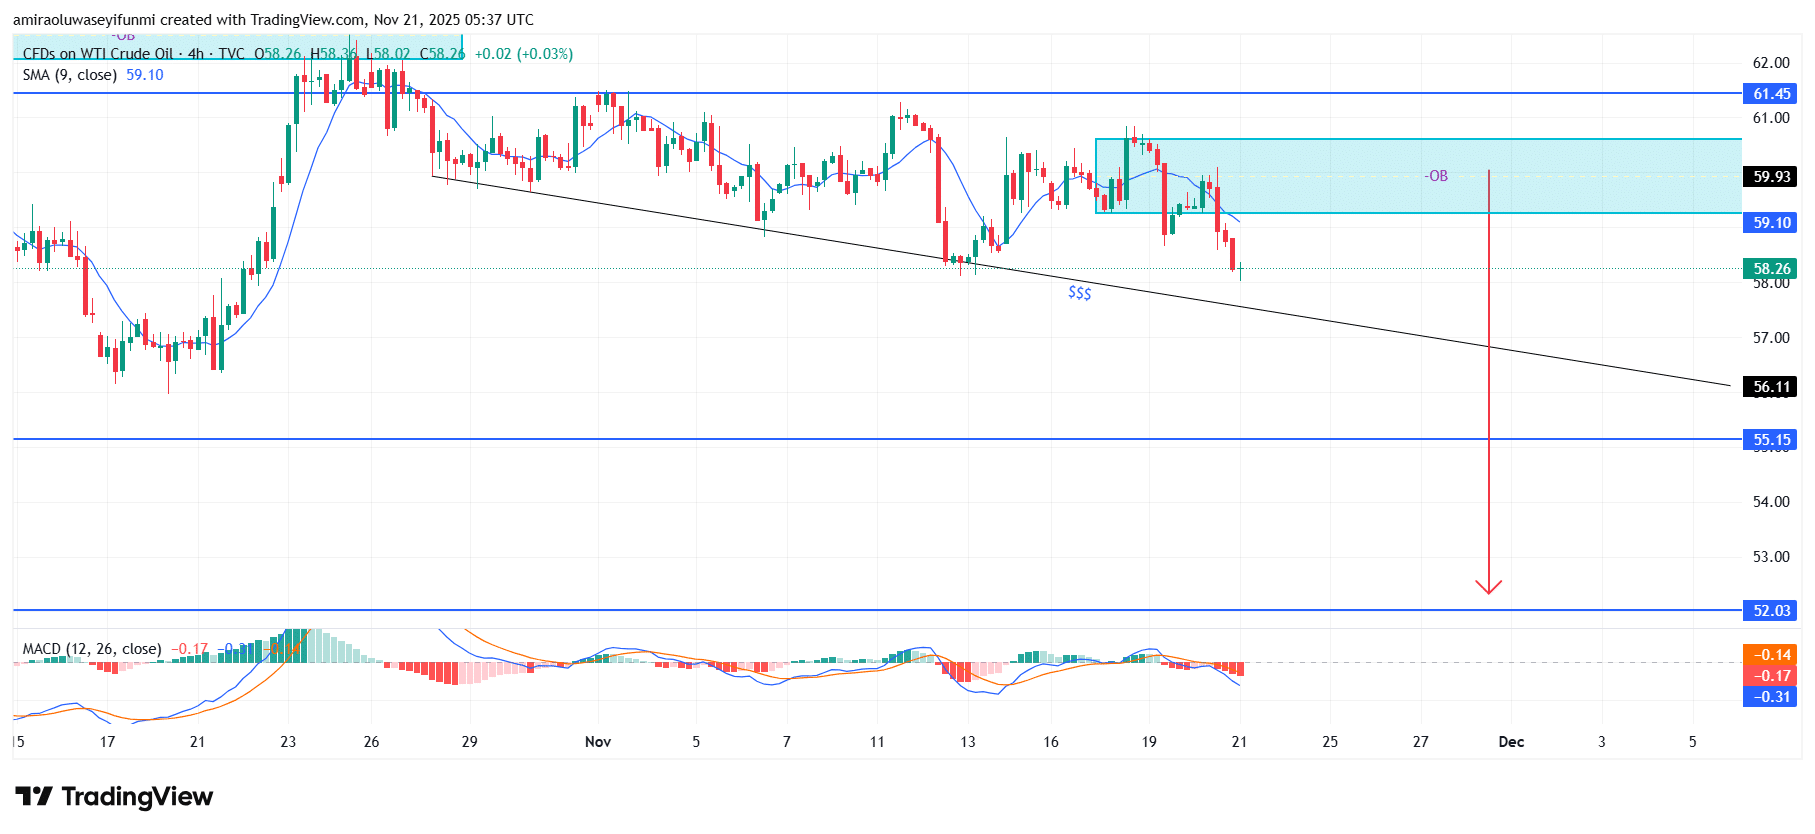
USOil Short-Term Trend: Bearish
USOil is showing clear distribution characteristics as price continues to reject the supply area between $59.100 and $59.900. The steady formation of lower highs along the descending trendline signals weakening buying strength. Momentum indicators, including the MACD, remain muted, indicating fading bullish pressure. With liquidity resting around $56.100, the short-term structure points to increasing potential for a deeper bearish continuation, especially for traders monitoring forex signals.
Make money without lifting your fingers: Start using a world-class auto trading solution
How To Buy Lucky Block
Note: Learn2.trade is not a financial advisor. Do your research before investing your funds in any financial asset, product, or event. We are not responsible for your investment results.
- Broker
- Min Deposit
- Score
- Visit Broker

- Award-winning Cryptocurrency trading platform
- $100 minimum deposit,
- FCA & Cysec regulated

- 20% welcome bonus of upto $10,000
- Minimum deposit $100
- Verify your account before the bonus is credited
- Fund Moneta Markets account with a minimum of $250
- Opt in using the form to claim your 50% deposit bonus
Learn to Trade
Never Miss A Trade Again

Signal Notification
Real-time signal notifications whenever a signal is opened, closes or Updated

Get Alerts
Immediate alerts to your email and mobile phone.

Entry Price Levels
Entry price level for every signal Just choose one of our Top Brokers in the list above to get all this free.