Market Analysis – November 14
USOil exhibits sustained downside pressure as momentum weakens. The broader market structure continues to reflect a bearish operational outlook, with price action remaining below short-term moving averages and maintaining negative alignment across momentum indicators. The MACD histogram remains subdued, signaling fading bullish attempts and reinforcing a downward-leaning sentiment. This overall confluence suggests that market participants are gradually positioning for reduced buying interest and a likely continuation of supply-driven price weakening.
USOil Key Levels
Resistance Levels: $61.50, $66.40, $72.20
Support Levels: $55.20, $52.00, $50.10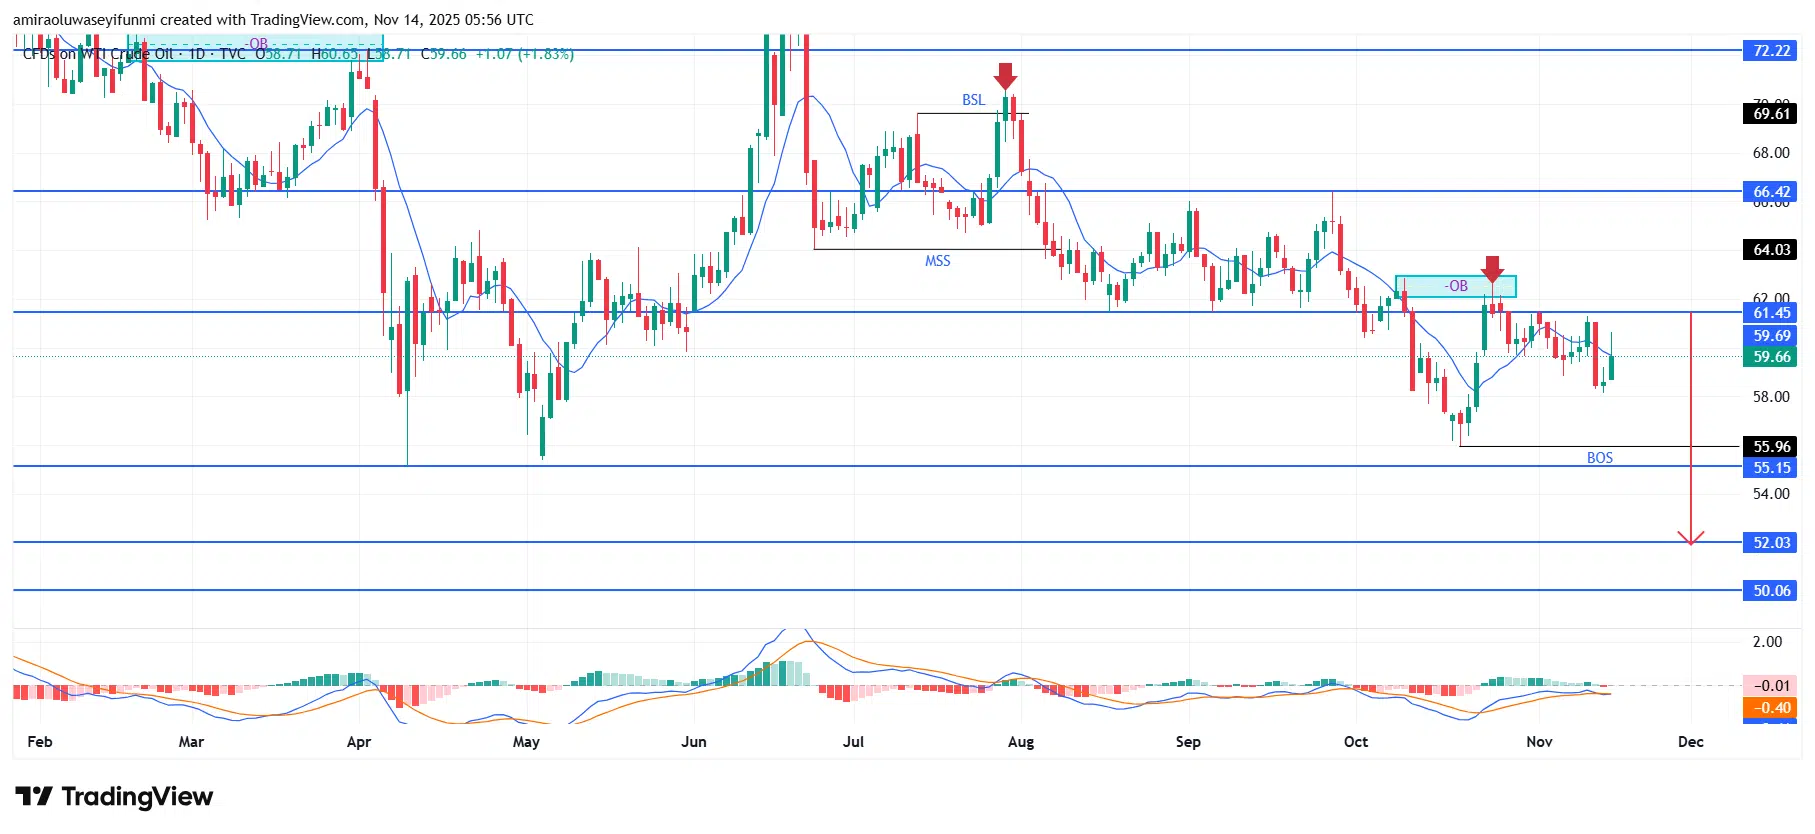
USOil Long-Term Trend: Bearish
Structurally, the market has respected several technical points that support the ongoing bearish narrative. The recent rejection at the $61.50 resistance level—strengthened by the bearish order block—signals that the market is firmly defending overhead liquidity. The earlier break of structure at $56.00 and the continued inability of buyers to push price higher highlight sustained downside imbalance. Price action also maintains a sequence of lower highs and lower lows, reflecting a consistent bearish order flow that aligns with current market conditions.
Looking ahead, the technical outlook suggests an increased likelihood of further downside continuation. If bearish momentum persists, price may move into the $55.20 demand region, with an extended objective toward $52.00 as broader liquidity targets become more pronounced. A deeper slide toward $50.10 remains possible if macroeconomic pressures reinforce supply dominance. Unless price reclaims $61.50 on a daily closing basis, the bias remains tilted toward continued depreciation, with traders potentially monitoring forex signals for additional directional cues.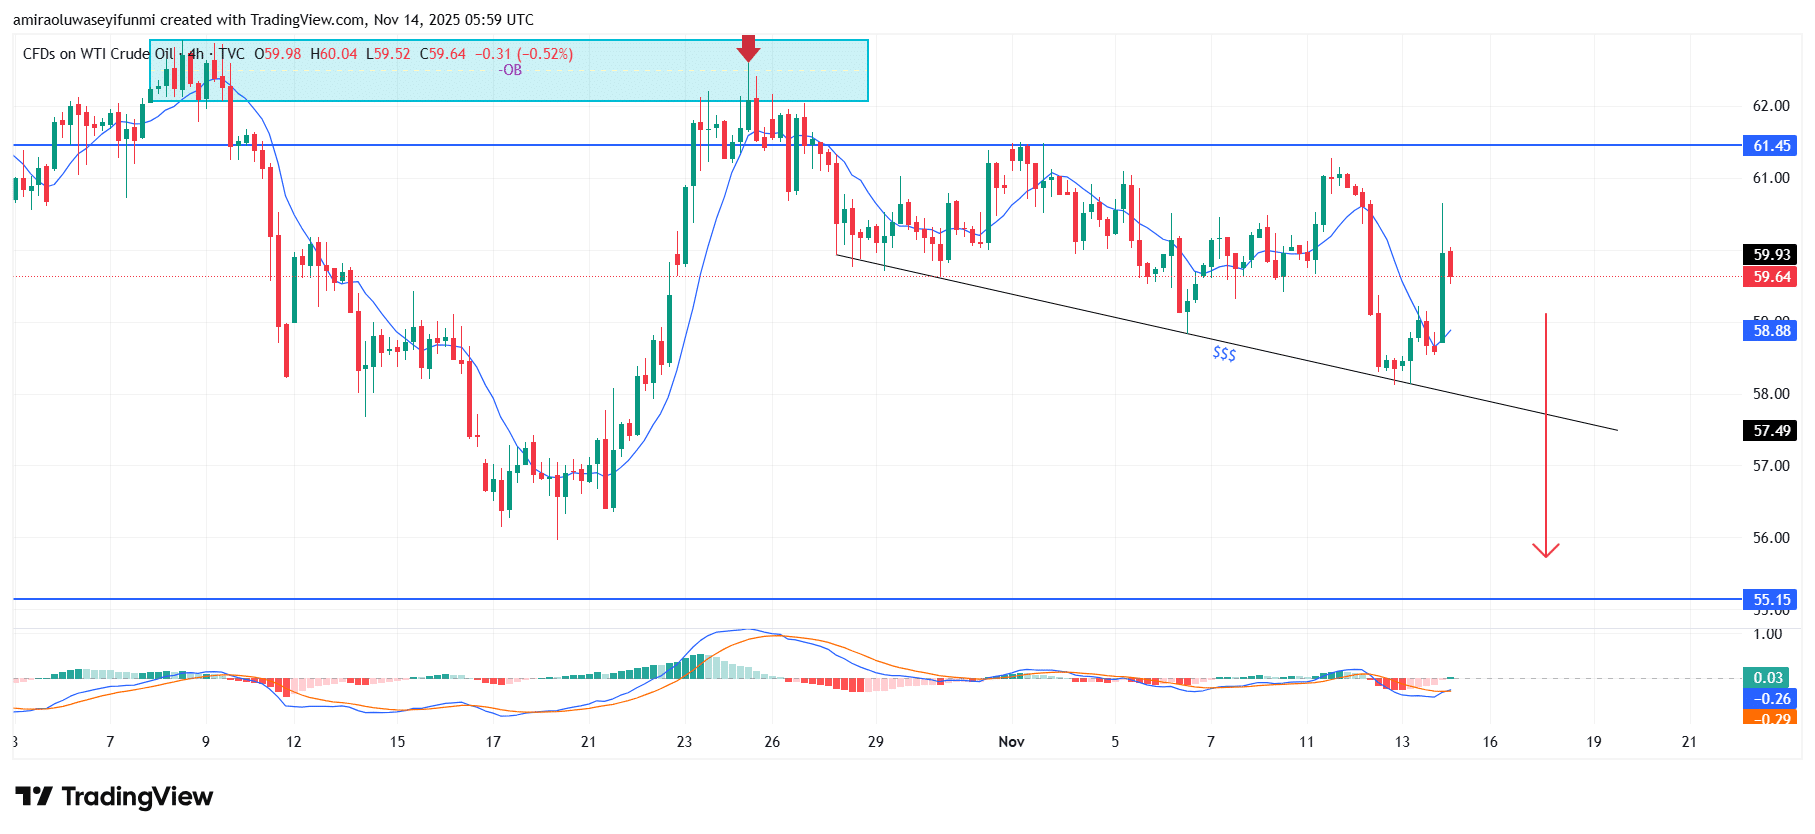
USOil Short-Term Trend: Bearish
USOil maintains a bearish structure on the four-hour chart as price continues to trade below the $61.50 resistance and struggles to hold above short-term moving averages. The rejection from the order-block region around $60.00–$61.00 reinforces sellers’ dominance, with price respecting the descending pattern.
Market flow continues to produce lower highs as liquidity gradually gravitates toward the $58.90 support. A clear break below this level may pave the way for a deeper move toward $55.20.
Make money without lifting your fingers: Start using a world-class auto trading solution
How To Buy Lucky Block
Note: Learn2.trade is not a financial advisor. Do your research before investing your funds in any financial asset, product, or event. We are not responsible for your investment results.
- Broker
- Min Deposit
- Score
- Visit Broker

- Award-winning Cryptocurrency trading platform
- $100 minimum deposit,
- FCA & Cysec regulated

- 20% welcome bonus of upto $10,000
- Minimum deposit $100
- Verify your account before the bonus is credited
- Fund Moneta Markets account with a minimum of $250
- Opt in using the form to claim your 50% deposit bonus
Learn to Trade
Never Miss A Trade Again

Signal Notification
Real-time signal notifications whenever a signal is opened, closes or Updated

Get Alerts
Immediate alerts to your email and mobile phone.

Entry Price Levels
Entry price level for every signal Just choose one of our Top Brokers in the list above to get all this free.