Market Analysis – August 8
USOil is experiencing renewed buying pressure from the key demand zone at $65.30. The commodity has shifted toward a bullish bias after testing a significant order block near the $63.00 region.
On the daily chart, price action signals a potential reversal as it attempts to stabilize above this demand area. The 9-day Simple Moving Average (SMA) at $66.60 remains slightly above current levels, indicating that a breakout above this dynamic resistance could reinforce upward momentum. The Relative Strength Index (RSI) sits near 39, pointing to the fact that although the asset was recently oversold, there is still room for recovery.
USOil Key Levels
Resistance Levels: $72.20, $80.70, $84.50
Support Levels: $65.30, $55.20, $52.00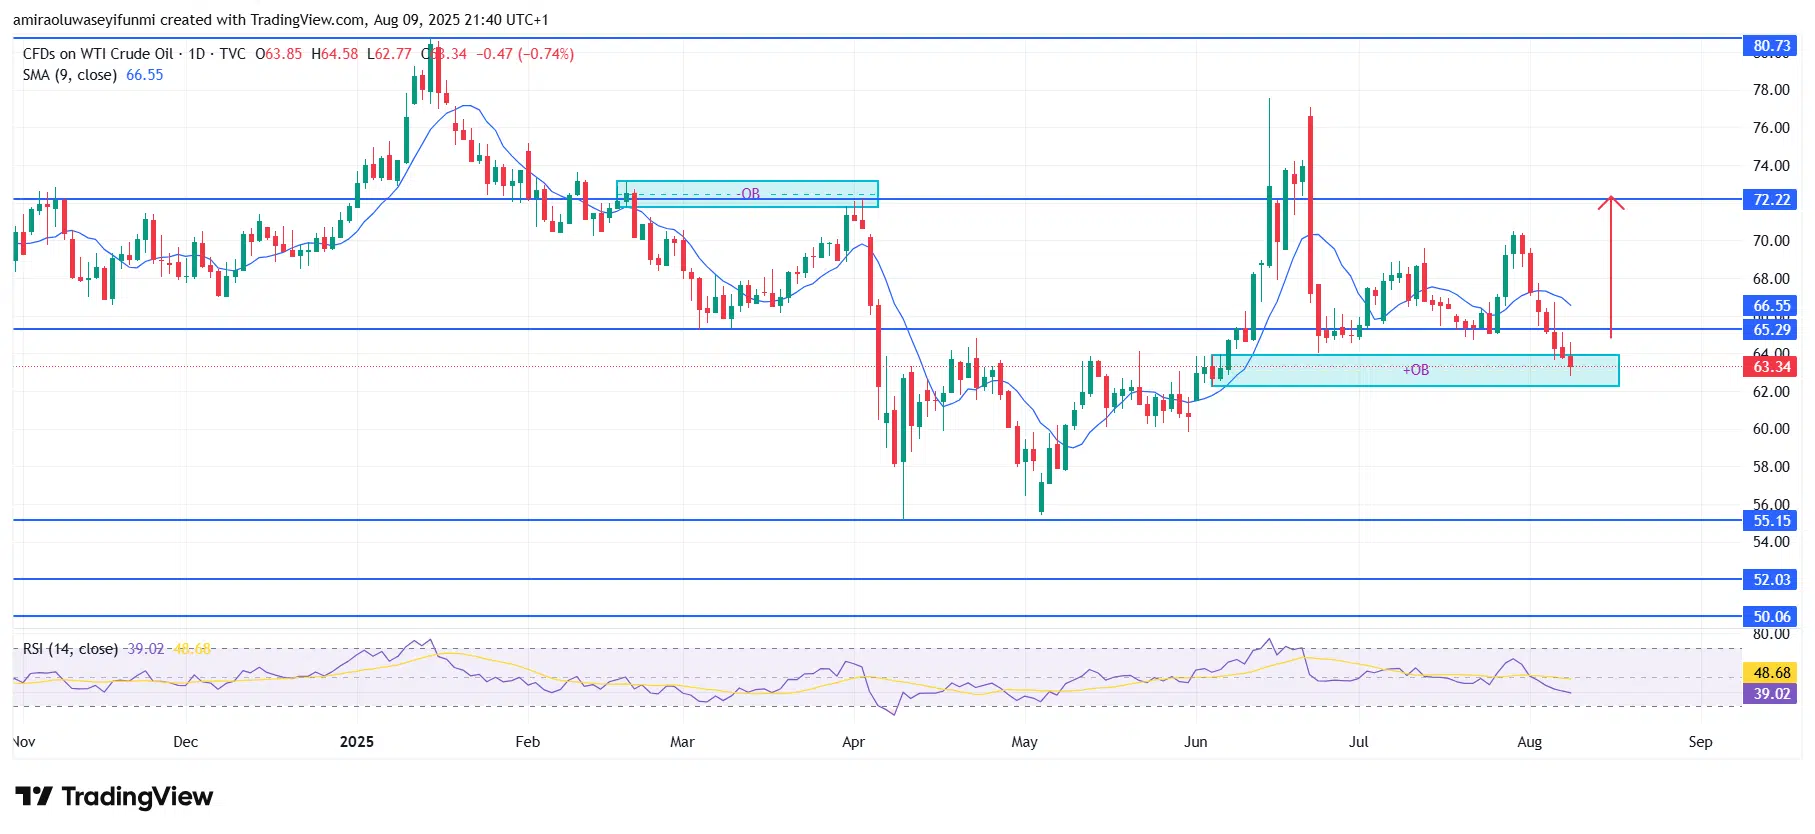
USOil Long-Term Trend: Bullish
Price action confirms that the $63.00–$65.30 support range remains a significant reaction zone, halting prior declines. Past sell-offs into this area have met strong buying interest, resulting in sharp rebounds. This behavior aligns with a visible bullish order block, suggesting concentrated institutional demand. The inability of sellers to drive price sustainably below this range highlights weakening bearish momentum, paving the way for a possible recovery toward higher resistance points.
Looking ahead, the first upside target is at $66.60, where a successful breakout could open the path toward the $72.20 resistance zone. If bullish momentum is sustained above this level, price could extend gains toward $80.70 in the medium term. On the other hand, $63.00 remains a key support level, with the possibility of a deeper decline toward $55.20 only if this demand zone is broken. Current market structure suggests accumulation rather than distribution, which supports a bullish recovery outlook. Traders watching forex signals may find these technical levels important for assessing potential entry points.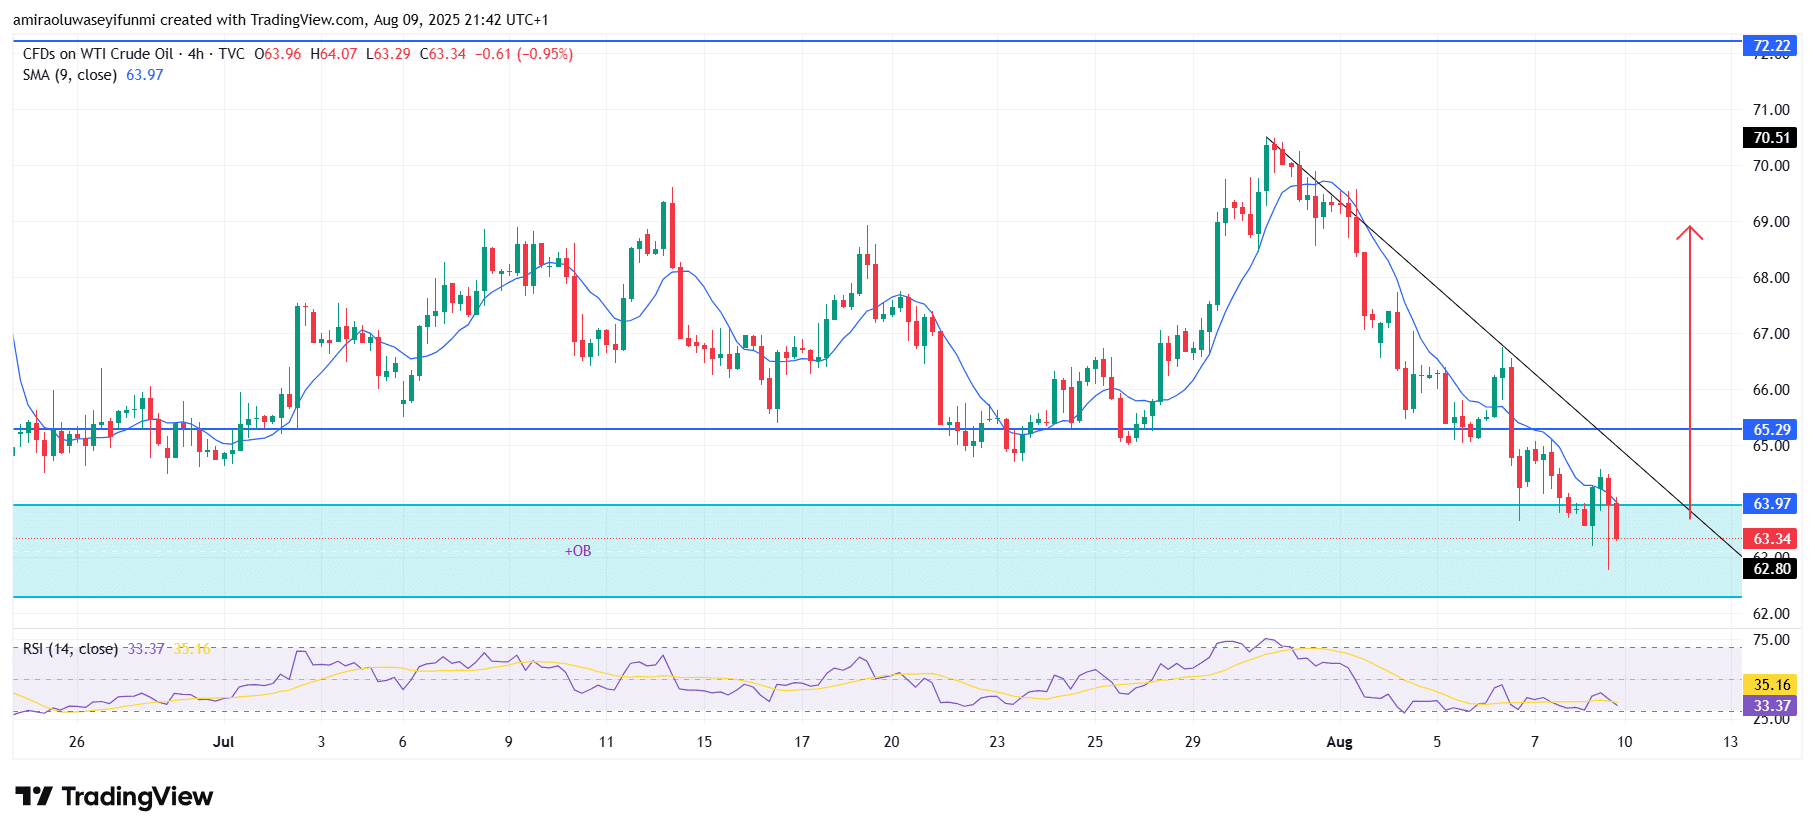
USOil Short-Term Trend: Bullish
In the short term, USOil is showing early signs of a bullish reversal after testing the $62.80 demand zone. Price is attempting to break above the descending trendline, with the 9-period SMA at $64.00 serving as immediate resistance.
The RSI at 35 reflects oversold conditions, pointing to the likelihood of upward momentum. A sustained push above $65.30 could set the stage for a rally toward $70.50 in the near term.
Make money without lifting your fingers: Start using a world-class auto trading solution
How To Buy Lucky Block – Guide, Tips & Insights | Learn 2 Trade
Note: Learn2.trade is not a financial advisor. Do your research before investing your funds in any financial asset, product, or event. We are not responsible for your investment results.
- Broker
- Min Deposit
- Score
- Visit Broker

- Award-winning Cryptocurrency trading platform
- $100 minimum deposit,
- FCA & Cysec regulated

- 20% welcome bonus of upto $10,000
- Minimum deposit $100
- Verify your account before the bonus is credited
- Fund Moneta Markets account with a minimum of $250
- Opt in using the form to claim your 50% deposit bonus
Learn to Trade
Never Miss A Trade Again

Signal Notification
Real-time signal notifications whenever a signal is opened, closes or Updated

Get Alerts
Immediate alerts to your email and mobile phone.

Entry Price Levels
Entry price level for every signal Just choose one of our Top Brokers in the list above to get all this free.