Market Analysis – April 18
USOil exhibits a bearish trend while undergoing a temporary bullish correction. Technical indicators on the daily chart point to short-term upward movement within a larger bearish framework. The Relative Strength Index (RSI) currently stands at 45.83, rebounding from previous oversold levels and signaling emerging bullish momentum, though it remains below the neutral 50 mark. This corresponds with the recent bounce from the support zone near $61.80, just above the 9-period Simple Moving Average (SMA) positioned at $61.30. Price movement above this short-term average suggests the pullback may extend toward higher resistance levels.
USOil Key Levels
Resistance Levels: $65.30, $72.20, $80.70
Support Levels: $61.80, $55.20, $52.00
USOil Long-Term Trend: Bearish
Recent price action reveals that USOil has established a temporary bottom around the $60.00 region, bouncing strongly after a steep bearish decline. The ongoing recovery is now approaching the $65.30 resistance level, which corresponds with earlier structural highs. Just above this lies the bearish order block around $70.00, a zone that previously acted as a supply region, exerting significant downward pressure. The upper order block at $72.20 remains untouched and represents another confluence zone that could limit further bullish attempts. Price is currently trading around $63.70, indicating a short-lived rebound within clearly defined levels.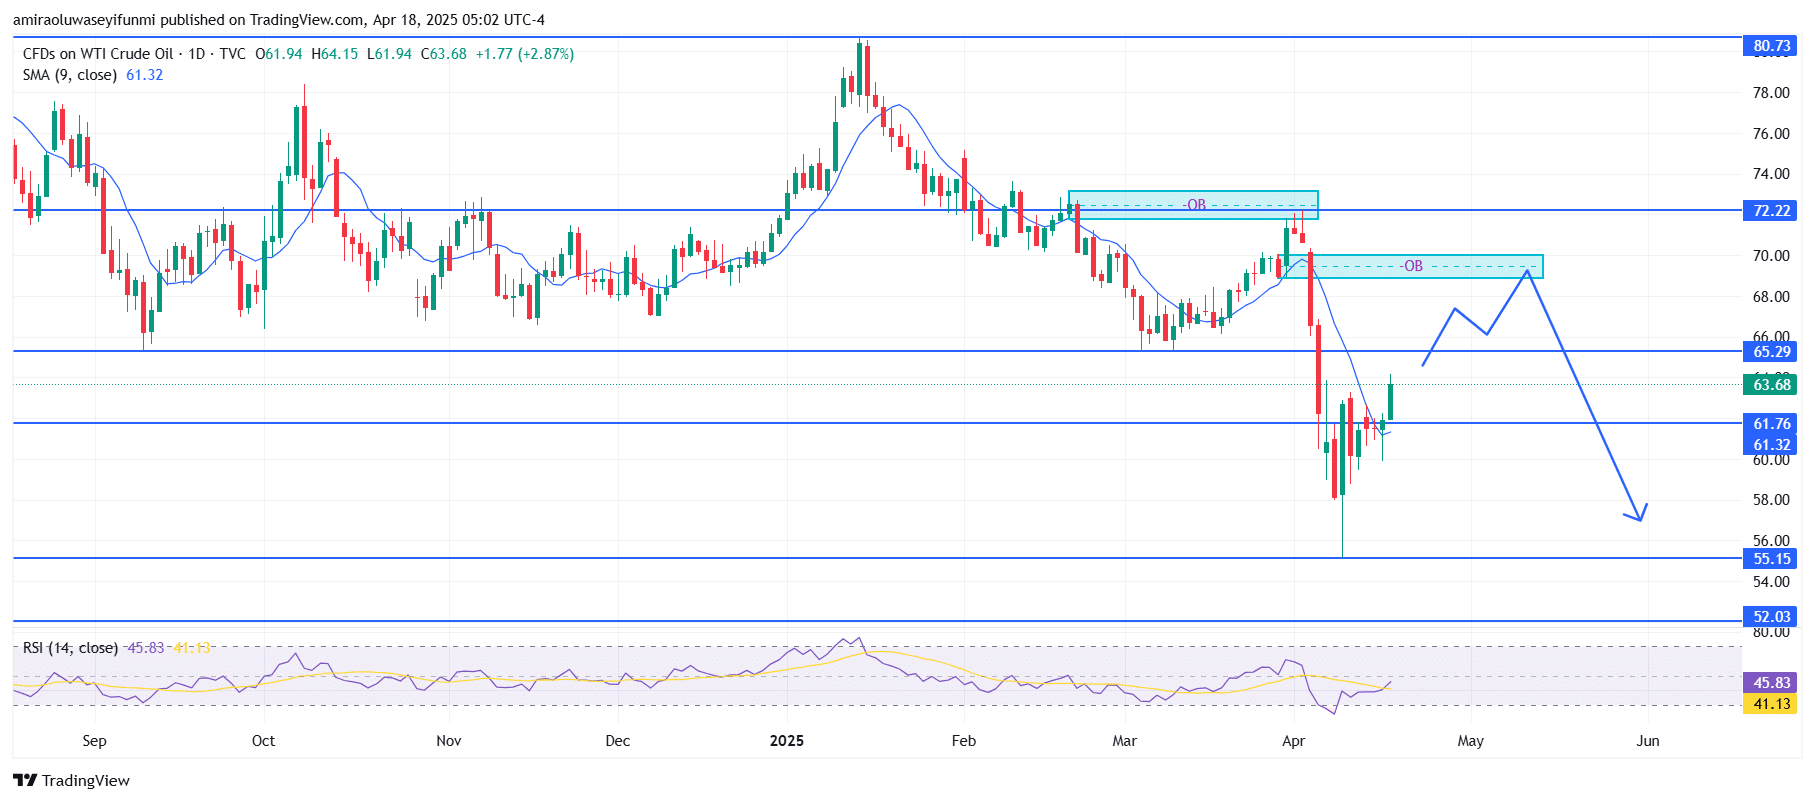
USOil Short-Term Trend: Bullish
On the 4-hour chart, USOil is displaying bullish momentum following the formation of a breaker block near $61.80. Price has broken structure, marked by a market structure shift, and is now trading above the 9-period SMA, which has turned into dynamic support.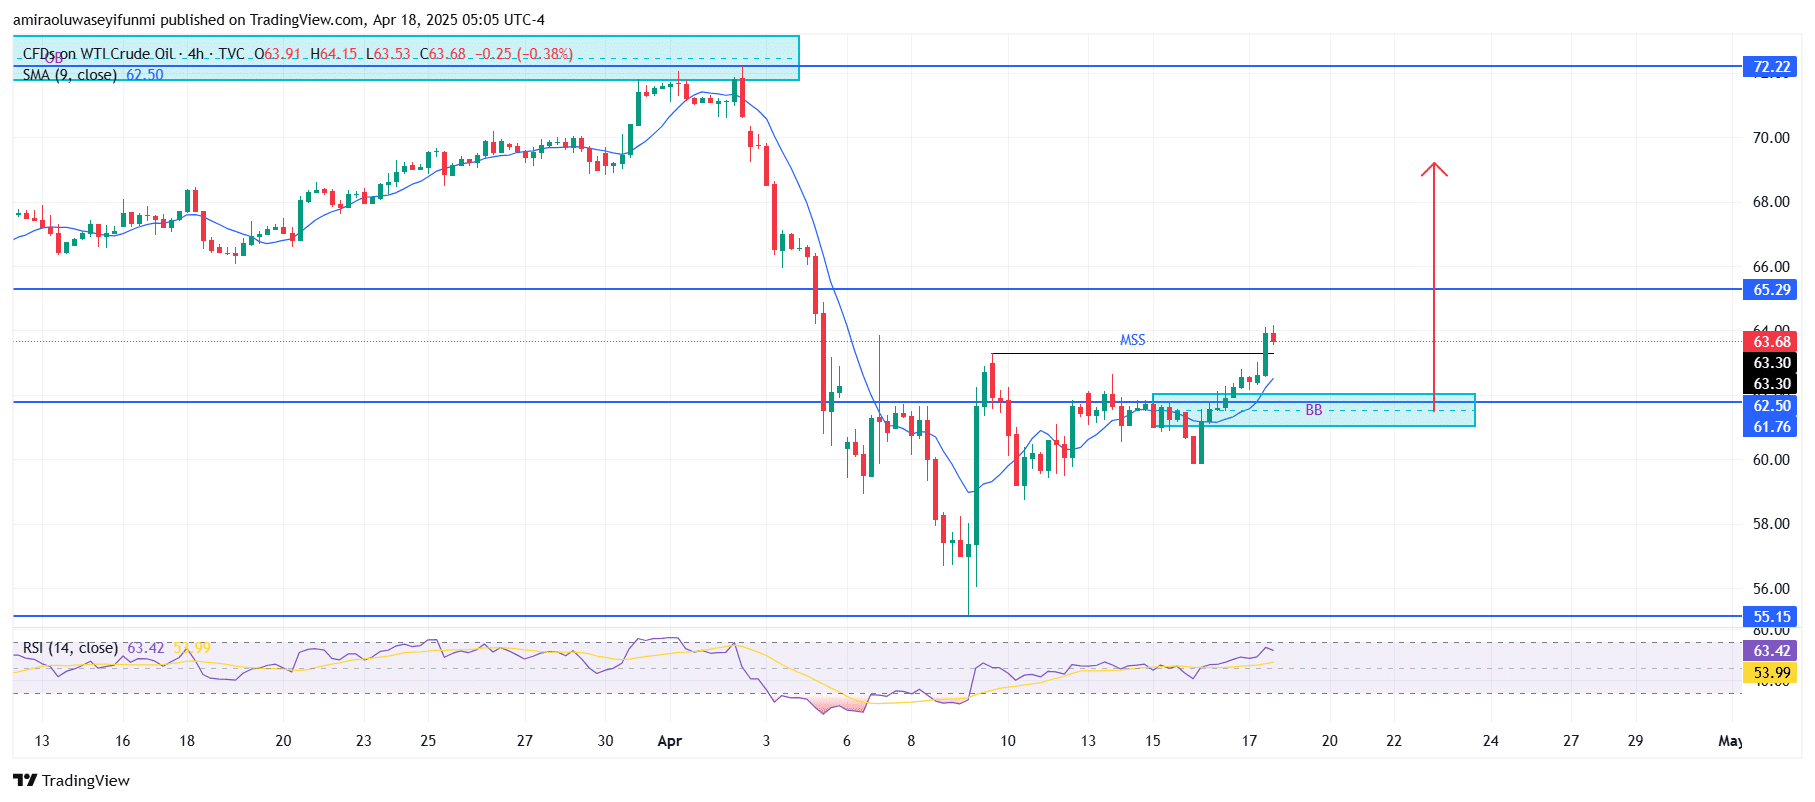
Make money without lifting your fingers: Start using a world-class auto trading solution
How To Buy Lucky Block – Guide, Tips & Insights | Learn 2 Trade
Note: Learn2.trade is not a financial advisor. Do your research before investing your funds in any financial asset, product, or event. We are not responsible for your investment results.
- Broker
- Min Deposit
- Score
- Visit Broker

- Award-winning Cryptocurrency trading platform
- $100 minimum deposit,
- FCA & Cysec regulated

- 20% welcome bonus of upto $10,000
- Minimum deposit $100
- Verify your account before the bonus is credited
- Fund Moneta Markets account with a minimum of $250
- Opt in using the form to claim your 50% deposit bonus
Learn to Trade
Never Miss A Trade Again

Signal Notification
Real-time signal notifications whenever a signal is opened, closes or Updated

Get Alerts
Immediate alerts to your email and mobile phone.

Entry Price Levels
Entry price level for every signal Just choose one of our Top Brokers in the list above to get all this free.