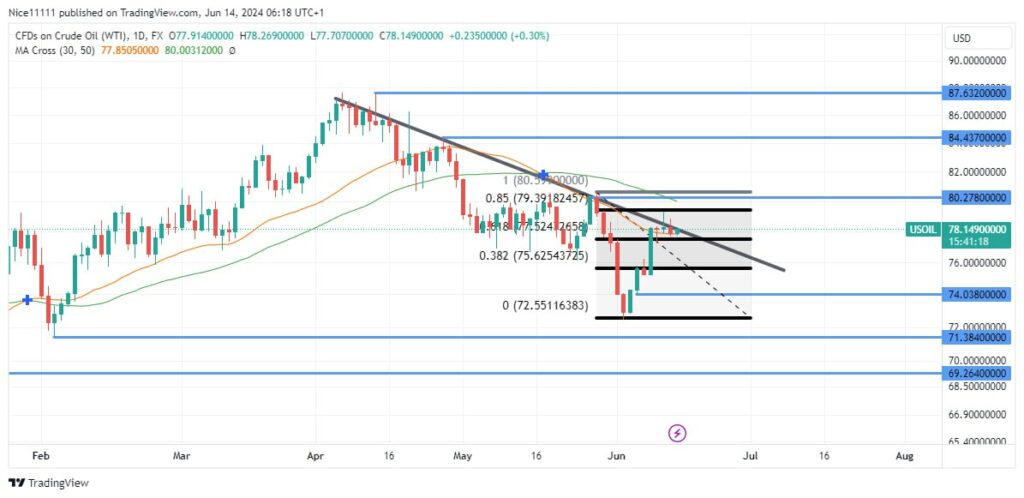
The bearish trend in USOil commenced after the bullish order block at 80.00 failed to hold. This led to a reaccumulation phase within the 80.00 to 75.00 range throughout May. The emergence of three black crows following a Judas swing pattern signaled the resumption of the downtrend, confirmed by a bearish break of structure.
USOil Key Levels:
Demand Levels: 74.00, 71.40, 69.30
Supply Levels: 80.30, 84.40, 87.60
USOil Long-Term Trend: Bearish
In April, the formation of a head and shoulders pattern indicated a bearish reversal. This was further confirmed as the 30-period moving average crossed below the 50-period moving average. The connection of lower highs on the daily chart aids in predicting future price pullbacks. The bearish trend experienced a temporary pause in May due to market consolidation. However, the trend resumed in June with the appearance of three black crows.
After reaching 73.00, the price experienced a retracement, currently reaching the 85% level on the Fibonacci retracement, placing it in the premium range of the last bearish displacement. A swing high has formed in this range as the price tested the bearish trendline.
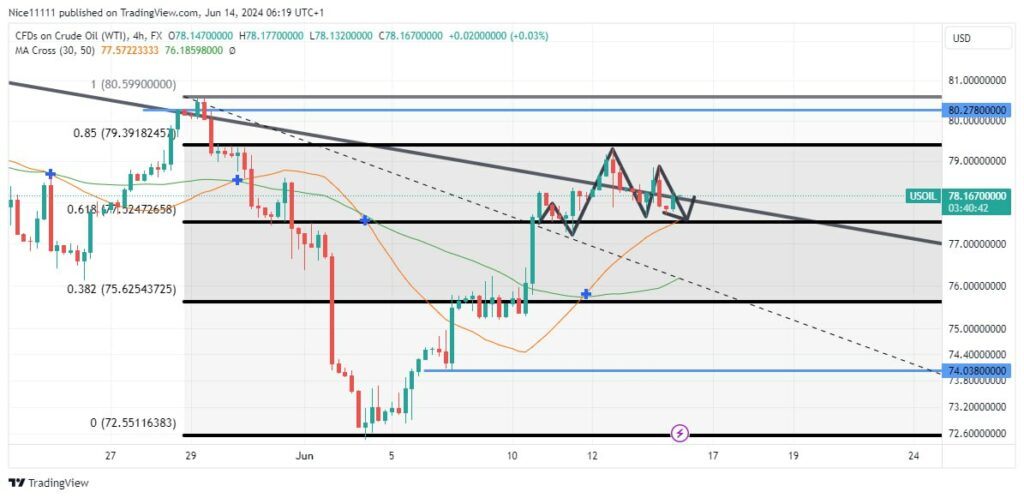
USOil Short-Term Trend: Bullish
On the 4-hour chart, the price trend appears bullish. This retracement on the daily chart translates to a bullish trend on the lower timeframe. A head and shoulders pattern has formed within the premium zone, potentially preceding a bearish reversal to continue the overall downtrend. The price is expected to break below the previous low of 72.60 upon the resumption of the downward trend.
You can purchase Lucky Block – Guide, Tips & Insights | Learn 2 Trade here. Buy LBLOCK
Note: Learn2.trade is not a financial advisor. Do your research before investing your funds in any financial asset or presented product or event. We are not responsible for your investing results.
Trade on MT4 with Leverage up to 1:500! Trade on MT4 with Leverage up to 1:500!
X
We use cookies to ensure that we give you the best experience on our website. If you continue to use this site we will assume that you are happy with it.