Don’t invest unless you’re prepared to lose all the money you invest. This is a high-risk investment and you are unlikely to be protected if something goes wrong. Take 2 minutes to learn more
LBLOCKUSD Price Forecast: June 13th
The Lucky Block – Guide, Tips & Insights | Learn 2 Trade price forecast shows that the crypto market has seen a reversal. The bulls are regaining control and pushing the price higher after a period of seller dominance.
LBLOCKUSD Long Term Trend: (1-Day Chart)
Key Levels
Resistance Levels: $0.00003270, $0.00002610
Support Levels: $0.00002610, $0.00001870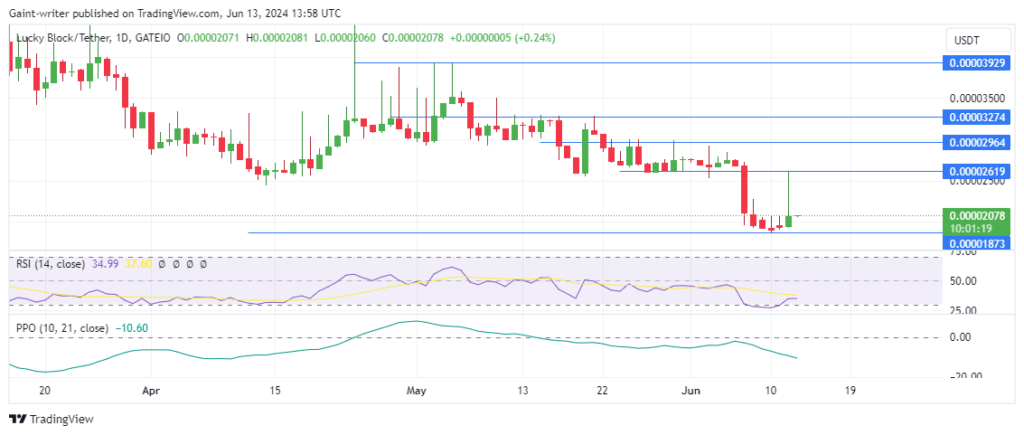
Lucky Block – Guide, Tips & Insights | Learn 2 Trade Price Forecast – Expert Analysis & Trading Tips | Learn 2 Trade – Expert Analysis & Trading Tips | Learn 2 Trade: LBLOCKUSD Outlook
Following a consolidation phase in the LBLOCKUSD market over the previous weeks, a downward move occurred. Sellers took charge, breaching the $0.00002610 significant zone.
The sell-off pushed the price down to the $0.00001870 market zone, but since then, the sellers have stepped out of the scene. Currently, buyers are pushing with renewed effort. As a result of the sellers’ influence, the Price Oscillator indicator has been below the 0.000 key level.
However, a rise in this indicator can confirm that buyers are building strong resilience against the selling opposition. The Relative Strength Index (RSI) is also nearing the oversold area, further reflecting a strong outlook for the buyers.
LBLOCKUSD Medium Term Trend: Bullish (4-hour chart)
On the daily chart, buyers are likely to keep forging ahead, while on the 4-hour chart, they are already gaining traction. The Price Oscillator indicator is above the 0.000 level, indicating a rise in their momentum, and the RSI also projects buy strength for the LBLOCK market.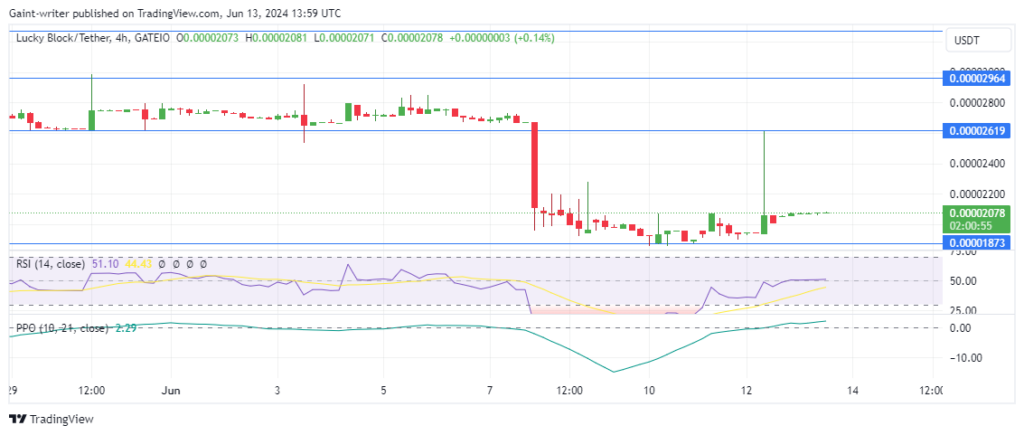
How To Buy Lucky Block – Guide, Tips & Insights | Learn 2 Trade
Note: Learn2.trade is not a financial advisor. Do your research before investing your funds in any financial asset, product, or event. We are not responsible for your investment results.
- Broker
- Min Deposit
- Score
- Visit Broker

- Award-winning Cryptocurrency trading platform
- $100 minimum deposit,
- FCA & Cysec regulated

- 20% welcome bonus of upto $10,000
- Minimum deposit $100
- Verify your account before the bonus is credited
- Fund Moneta Markets account with a minimum of $250
- Opt in using the form to claim your 50% deposit bonus
Learn to Trade
Never Miss A Trade Again

Signal Notification
Real-time signal notifications whenever a signal is opened, closes or Updated

Get Alerts
Immediate alerts to your email and mobile phone.

Entry Price Levels
Entry price level for every signal Just choose one of our Top Brokers in the list above to get all this free.